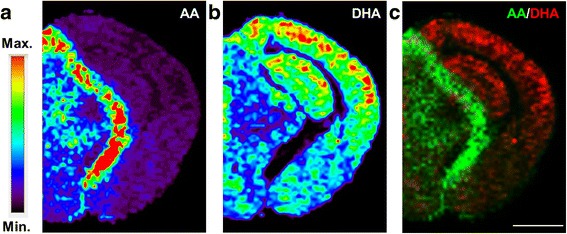
Fig. 4.

Distribution of arachidonic acid and docosahexaenoic acid within the brain. Non-Tg mouse brains were dissected, frozen, and sectioned coronally (10 μm sections). Representative MALDI-MS imaging heat maps from brain coronal sections (Bregma −2.4) for arachidonic acid (AA [M-H]−, m/z 303.23) (a) and docosahexaenoic acid (DHA [M-H]−, m/z 327.23) (b). c Merged image with AA in green and DHA in red, note their opposite distributions. MALDI-imaging resolution is 100 μm, scale bar = 2 mm
