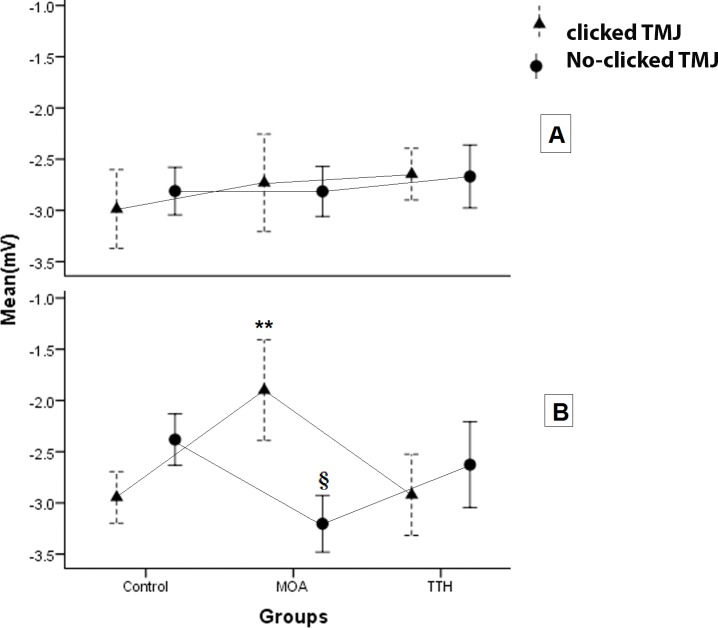
Figure 3. The plots show the mean of the energy of masseter activity during the cycles in the two sides of the three groups with or without clicked TMJ.
∗∗: A significant difference was seen in the left side among MOA group and the two other groups in clicked TMJ (P-value < 0.002). §: A significant difference was seen in left side among the MOA group and the two other groups in no-clicked TMJ (P-value < 0.02).

