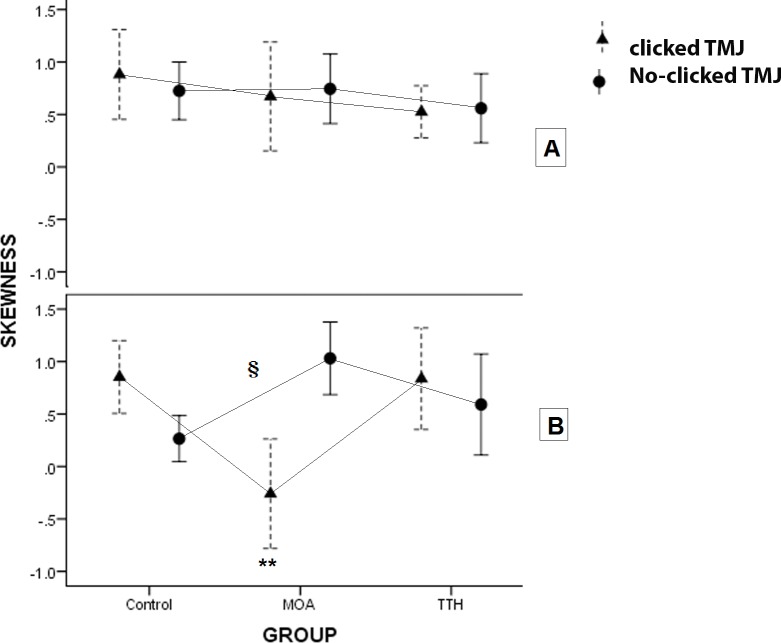
Figure 4. The plots show the skewness of energy of masseter activity during the cycles in the two sides of the three groups with clicked and no-clicked TMJ.
**: A significant difference was seen in the left side among MOA group and the two other groups in clicked TMJ (P-value < 0.002). §: There was a significant difference in the left side between MOA group and the control group in no-clicked TMJ (P-value < 0.002).

