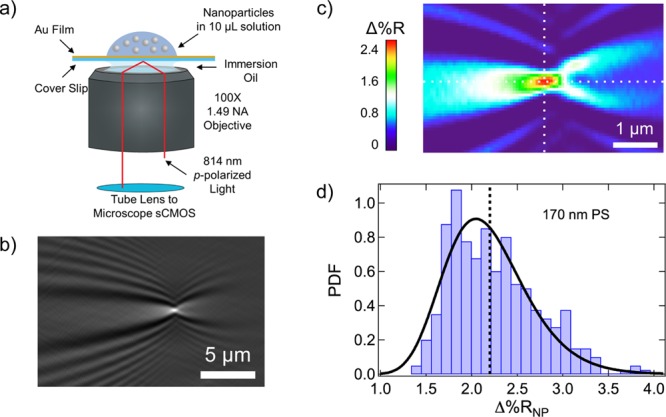
Figure 1.

(a) Schematic diagram of the SPRI microscope. A gold-coated knife-edge mirror was used to direct collimated p-polarized light off-axis through the microscope objective and onto the back of the gold-coated glass coverslip. The reflected image was captured with a CMOS camera. A nanoparticle solution was exposed to the top of the gold-coated glass coverslip immediately preceding the image acquisition process. (b) A point diffraction pattern is observed in the SPRI differential reflectivity image when a 170 nm polystyrene (PS) nanoparticle adsorbs to the chemically modified gold surface. (c) Quantitative map displaying the Δ%R pixel intensities for the single-nanoparticle point diffraction pattern in (b). A sharp spike in Δ%R intensity is observed at the center of the diffraction pattern (the intersection of the two white dotted lines). We define Δ%RNP as the average of the Δ%R values for the nine pixels at and surrounding the pixel with the maximum Δ%R intensity. (d) Δ%RNP frequency distribution histogram obtained from the SPRI adsorption measurement of 170 nm PS nanoparticles. The average Δ%RNP value for this experiment was 2.19 ± 0.05% and is plotted in the figure as a black dotted line. The Δ%RNP distribution is also fit to a probability density function (PDF) with location (μ) and scale (σ) parameters of 0.76 and 0.21, respectively.
