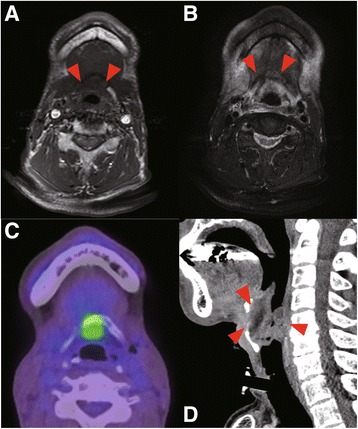
Fig. 4.

a Signal intensity decreased in the hyoid on T1WI, b Mixed high and low signal intensity on T2WI The arrows indicate the ORN of hyoid bone. c PET-CT shows focal high FDG activity in the hyoid and larynx. d Sagittal view of CT scan in the larynx. The red arrows indicated edematous swelling of laryngeal mucosa and stenosis
