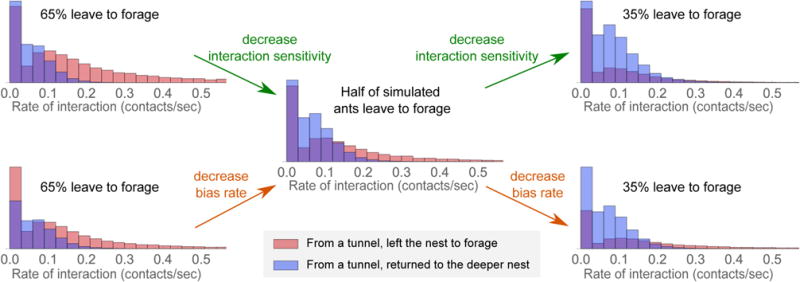
FIGURE 10. Possible mechanisms underlying regulation of foraging rate.

The fraction that leave the nest to forage f (shown decreasing progressively from the left column to the right column) depends on the interaction sensitivity k and constant bias rate γ. Individual panels show the interaction rate distributions for simulated ants that left the nest to forage vs. those that returned to the deeper nest. Parameter values of S0, σ, and rin were used from Figure 6A, and the evidence parameters k and γ were given the following values: (left-top) k = 0.36, γ = −0.038, (left-bottom) k = 0.22, γ = −0.023, (middle) k = 0.22, γ = −0.038, (right-top) k = 0.026, γ = −0.038, (right-bottom) k = 0.22, γ = −0.056.
