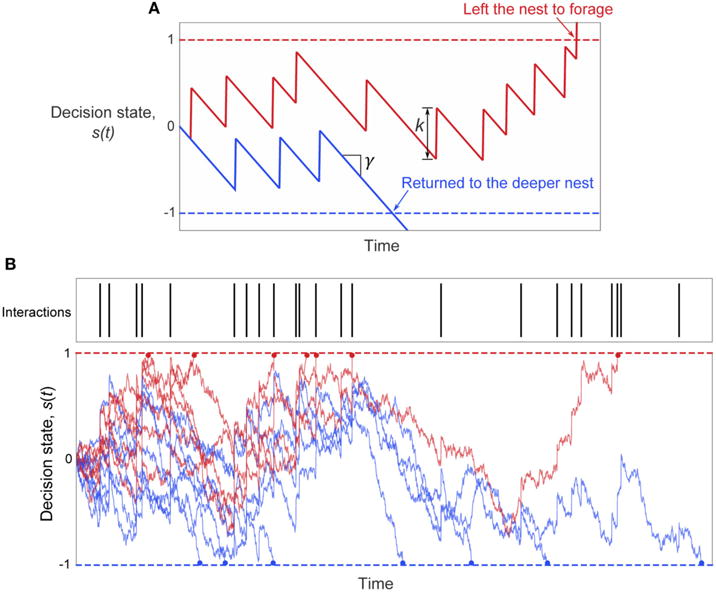
FIGURE 5. The two-choice model of ant foraging decisions.

(A) Illustration of the decision model parameters. Noise Is omitted to better Illustrate the roles of the parameters γ and k (see Equation 2) in determining the ant’s decision in response to interactions. The bias rate γ sets the mean rate of change of the decision state in the absence of interactions, and k sets the increase in the decision state with each interaction. The initial decision state is set by the parameter s0, and is set to zero for this example. (B) Example trajectories of the decision state with noise for the set of interaction times shown. Red lines: decision state s(t) of simulated ants that left the nest to forage. Blue lines: decision state s(t) of simulated ants that returned to the deeper nest. The decision time is shown by the dot at the end of each simulated decision path.
