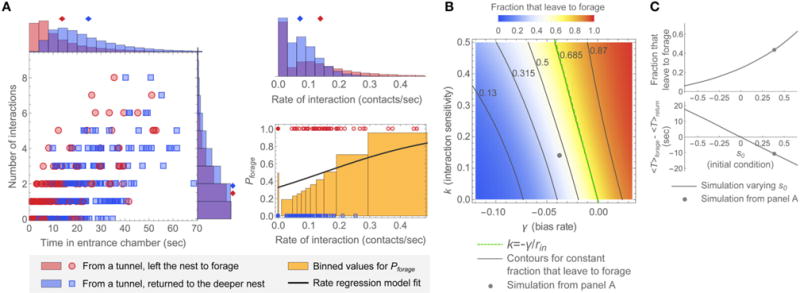
FIGURE 6. Representative simulated distributions and model parameter dependence.

(A) Simulated distributions of N, T, and r, and rate regression model fit of Pforage to the simulated data. Plots were generated in the same manner as for the data of Figures 3, 4. Parameters for this example were chosen so that the simulations resemble the observation of colony 2: k = 0.14, γ = −0.038, s0 = 0.39, and σ = 0.21. The mean input interaction rate, rin = 0.083, was calculated from the data for this observation (see Figure S2). The 2D plot and corresponding N, T, and r distributions display data for 400 simulated ants. The plot of Pforage (bottom right) shows rates as points for 200 simulated ants. (B,C) Effects of changing parameters around the values used in this example. (B) Dependence of the fraction of simulated ants leaving the nest to forage on the interaction sensitivity k and bias rate γ. Parameter values for s0, σ, and rin were the same as in (A). The point shows the result from (A), the dashed line shows the “constant decision fraction” line for k = −γ/rin, and the solid lines show evenly spaced contours at and around the line k = −γ/rin. (C) Model dependence on the initial decision state s0. (top) Fraction that leave the nest to forage. (bottom) Difference in average decision time between groups of ants, 〈Tforage〉 − 〈Treturn〉, where 〈Tforage〉 is the average decision time for ants that left the nest to forage and 〈Treturn〉 is the average decision time for ants that returned to the deeper nest. The point on each plot shows the result from (A). Parameter values for k, γ, σ, and rin were the same as in (A).
