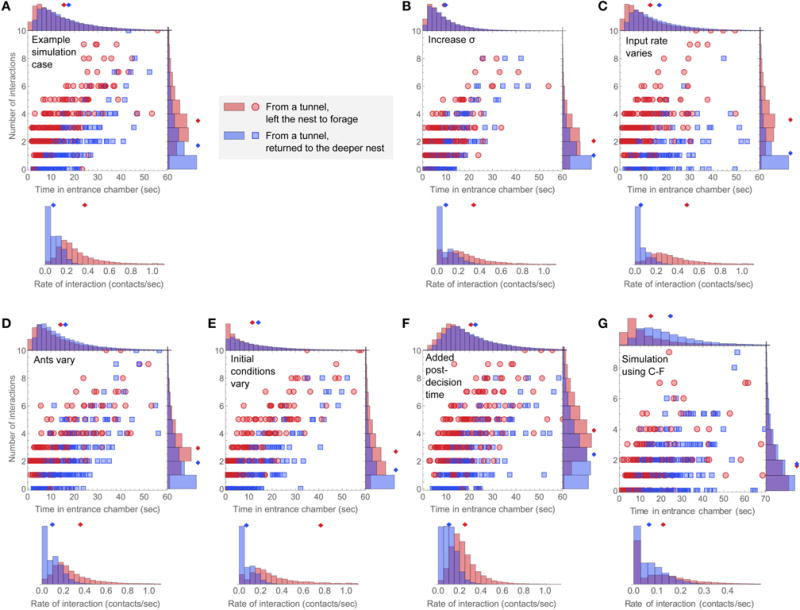
FIGURE 8. Simulating sources of variability.

For each case, the number of interactions vs. time in the entrance chamber is plotted for 400 simulated ants, and histograms for the distributions of number of interactions, time in the entrance chamber, and rate of interaction are shown for simulated ants in each group. (A) An example simulation using parameters k = 0.4, γ = −0.06, s0 = 0, σ = 0.2, and rin = 0.15. (B–F) show perturbations to this case. (B) Increased noise in the decision variable, from σ = 0.2 to σ = 0.3. (C) The input Poisson interaction rate rin was drawn from a uniform distribution from 0 to for each simulated ant. (D) The interaction sensitivity k and bias rate γ were drawn from normal distributions with mean values the same as in panel A, and standard deviations of 50% of the mean. (E) The initial decision state, s0, was drawn from a uniform distribution from −0.75 to 0.75. (F) Simulated ants have an added post-decision time drawn from a uniform distribution of 0–10 s., during which they continue to engage in interactions at the Poisson rate of rin = 0.15. (G) An example simulation including all of the added simulation mechanisms shown in (C–F), with parameters chosen to resemble the observation of colony 2. The noise level is σ = 0.21, the input rate of interaction was drawn from a uniform distribution from 0 to , the interaction sensitivity and bias rate were drawn from normal distributions defined by k = 0.14 ± 50% and γ = −0.038 ± 50%, the initial decision state was drawn from a uniform distribution from −0.2 to 0.8, and each simulated ant has an added post-decision time drawn from a uniform distribution from 0 to 5 s, during which it continues to make interactions at a Poisson rate drawn from a uniform distribution from 0 to .
