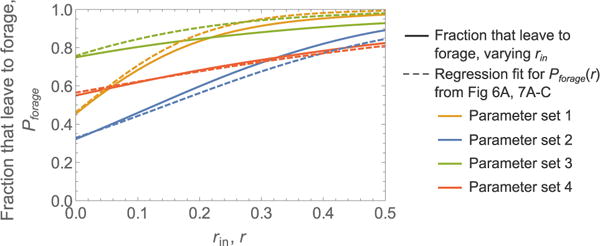
FIGURE 9. Changes in the fraction of ants that leave the nest to forage with mean input interaction rate.

Shown are simulation results for the fraction of ants that leave the nest to forage as a function of the mean input interaction rate rin (solid lines). These were obtained by performing multiple simulations with different values of rln, while other parameters remained the same. Rate regression fits for Pforage(r), reproduced from Figures 6A, 7, are shown for comparison; note that these simulations had fixed rin values and the different values of r shown here result from Poisson variability across ants in the experienced rate of interactions (number of contacts per second). Parameter sets 1, 2, 3, and 4 were taken from Figures 6A, 7A–C, to resemble the observations for colonies 1, 2, 3, and 4, respectively. Note that much of the difference between the curves for parameter set 3 is due to the added 5 s post-decision time in the simulations of Figure 7B, which was not included when generating the fraction that leave to forage as a function of rin.
