
Fig. 1.
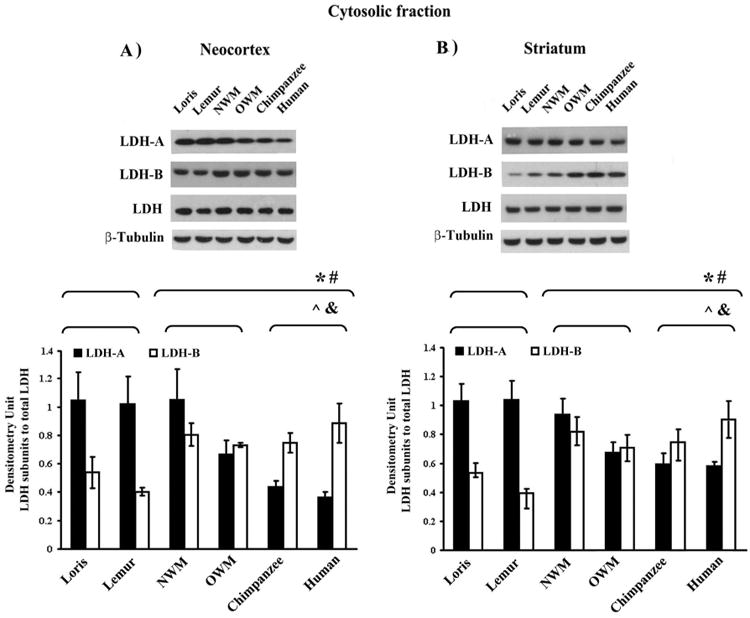
LDH isoenzyme expression levels in cytosolic fractions of primate forebrain structures. Representative Western blot showing the immunoreactive bands obtained with cytosolic LDH isoforms from neocortex (A), and striatum (B) separated by SDS-PAGE and immunoblotted with antibodies indicated from left. The amount of immunoreactive LDH isoenzymes shown were assessed by scanning densitometry of Western blots. Equal protein loading was confirmed with anti-β-tubulin antibody (see Supplemental Fig. A.4). Densitometry units were adjusted to an LDH total control. *, # p ≤ 0.05; Mann-Whitney U test for LDH-A and LDH-B, respectively. ˆ, & p ≤ 0.05; Kruskal–Wallis test for LDH-A and LDH-B, respectively.