
Fig. 2.
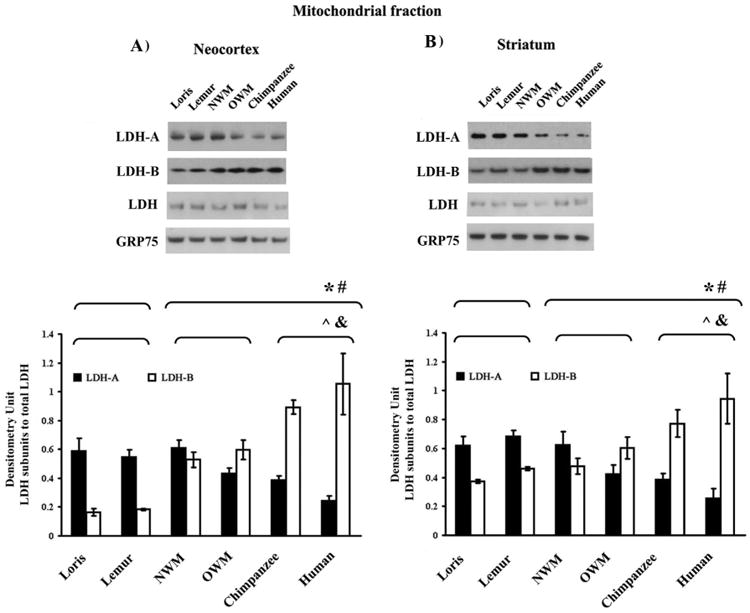
LDH isoenzyme patterns from the neocortical and striatal mitochondrial fractions. Upper panel shows representative Western blots of LDH isoenzymes from neocortex (A) and striatum (B). Quantification of the relative amount of LDH protein subunits was obtained by scanning gels. GRP75 was used as a loading control. The values obtained by densitometric analysis of the blotted LDH isoenzymes are shown in the bottom panel. *, The difference in the values of strepsirrhines vs. haplorhines was significant (Mann-Whitney U test, p ≤ 0.05). #, Kruskal-Wallis test of significant differences among the following primates groups: strepsirrhines, monkeys, and hominoids (p ≤ 0.05).