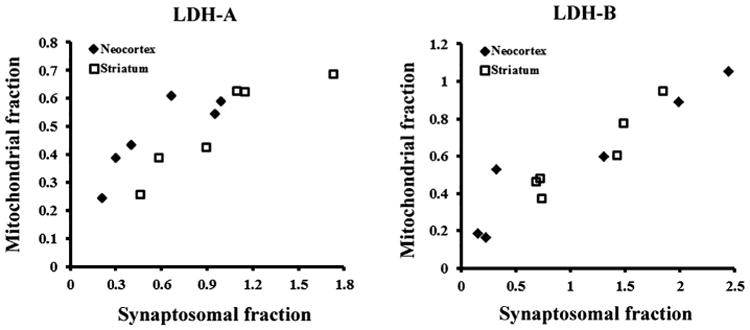
Fig. 3.

Scatterplots of mitochondria-associated LDH-A and LDH-B versus synapse-associated LDH isoform expression in primate neocortex and striatum. For this analysis, we used densitometry units for mitochondrial LDH isoenzymes based on Western blot and obtained densitometric estimates of the levels of LDH-A and LDH-B proteins in synaptosomal fractions from Duka et al. (2014). The previously published data values for the synaptosomal fractions was calculated in the same way as in the current study, and presented as the signal ratios of LDH protein subunits to the respective loading control first, and then to total LDH densities.
