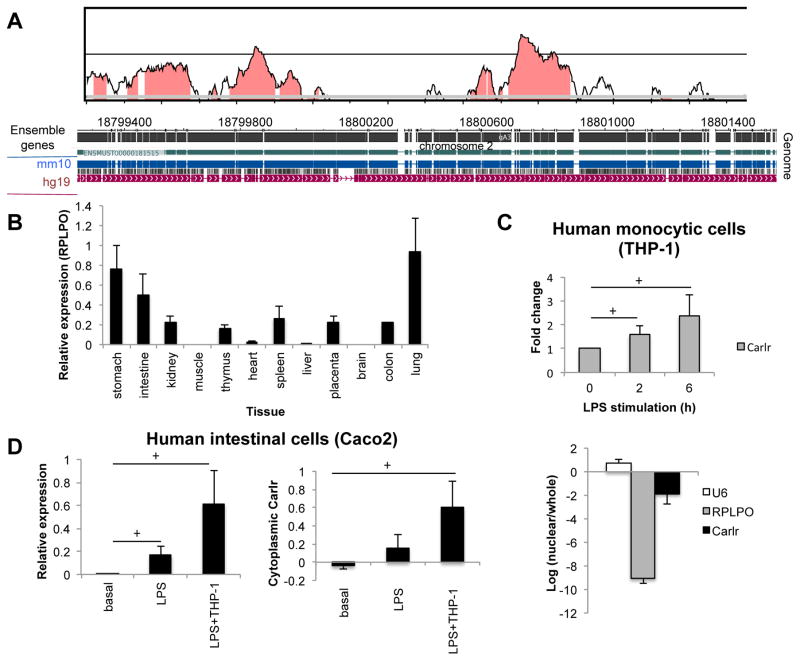
Figure 3.
A) Conservation analysis of Carlr region performed using VISTA (36). Mouse sequence is shown on the x-axis and percentage similarity to the corresponding human sequence on the y-axis. The graphical plot is based on sliding-window analysis of the underlying genomic alignment. A 100-bp sliding window is at 40-bp nucleotide increment is used. Pink shading indicates conserved noncoding genomic region (top). The image at the bottom represents pairwise alignment of the mouse and human genomes corresponding to Carlr region. Genome alignment was produced by blastz using WashU Epigenome Browser. B) Human Carlr expression (relative to stomach) measured by RT-qPCR in RNA pool of different tissues purchased from Clontech (Human total RNA master panel II) (average ± s.d; two independent RT-qPCRs). C) Expression of Carlr in basal conditions and after LPS stimulation (top) and localization of Carlr (bottom) in the human monocytic cell line THP-1. Data represents the average and standard error of three independent experiments. D) Expression (left) and cytoplasmic amount (right) of Carlr in the human intestinal cell line Caco2 at basal conditions and after incubation with LPS and with LPS stimulated THP-1 cells.

