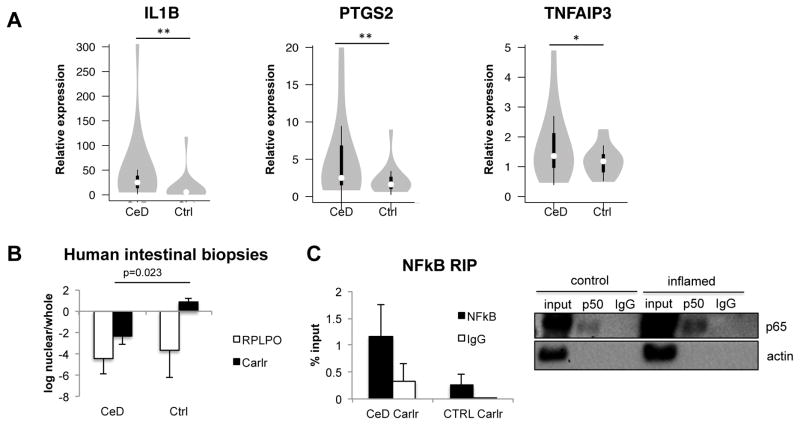
Figure 6.
A) Celiac disease patient intestinal biopsies have significantly higher levels of the Carlr targets measured by RT-qPCR. RPLPO was used as housekeeping gene. **p<0.05, *p=0.05; unpaired Students t-test. White circles show the medians; box limits indicate the 25th and 75th percentiles as determined by R software; whiskers extend 1.5 times the interquartile range from the 25th and 75th percentiles; polygons represent density estimates of data and extend to extreme values. B) Subcellular localization of Carlr in cells isolated from biopsies of five CeD patients and three controls. RPLPO was used as a control; p=0.023, unpaired Students t-test. C) Levels of Carlr bound to NF-κB after RIP performed in lysates from three control (non-inflammed) and three CeD patients (inflamed) (right). Representative WB of the immunoprecipitation (left).

