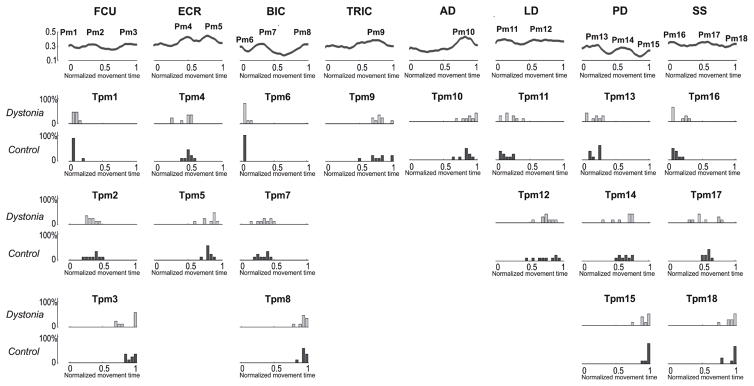
Figure 6. Between-group difference in the timings of muscle activity.
The upper row represents obtained by averaging each of the 8 envelopes over all control subjects. were used to identify the peaks of activation of the 8 muscles. 3 peaks for FCU (Pm1, Pm2 and Pm3), 2 peaks for ECR (Pm4 and Pm5), 3 peaks for BIC (Pm6, Pm7 and Pm8), 1 peak for TRIC (Pm9), 1 peak for AD (Pm10), 2 peaks for LD (Pm11 and Pm12), 3 peaks for PD (Pm13, Pm14 and Pm15), and 3 peaks for SS (Pm16, Pm17 and Pm18) were detected. Lower rows represent, for each group separately (Dystonia: light gray; Control: dark gray) the frequency distribution of the time of occurrence of each peak (Tman). No statistical between-group differences were reported for any of the peaks.

