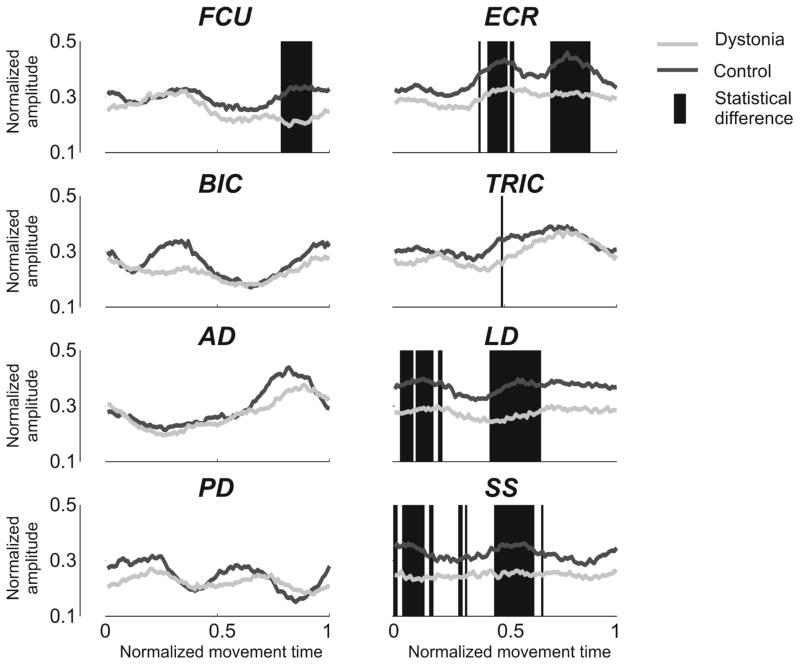
Figure 7. Between-group differences in the amplitude of muscle activity.
The Figure represents the envelopes of the 8 muscles (FCU: Flexor Carpi Ulnaris; ECR: Extensor Carpi Radialis; BIC: Biceps Brachii; TRIC: Triceps Brachii; AD: Anterior Deltoid; LD: Lateral Deltoid; PD: Posterior Deltoid; SS: Supraspinatus) during the execution of a single Figure 8 movement, averaged over each group (Dystonia: light gray; Control: dark gray). For each of the 100 time bins, statistical difference between the two groups is represented with a red background line. While t-test didn’t report any differences for BIC, AD, and PD (SimE values equal to 1), some between-group differences were highlighted for FCU, ECR, TRIC, LD, and SS (SimE= 0.86, 0.7, 0.99, 0.61, 0.64, respectively).

