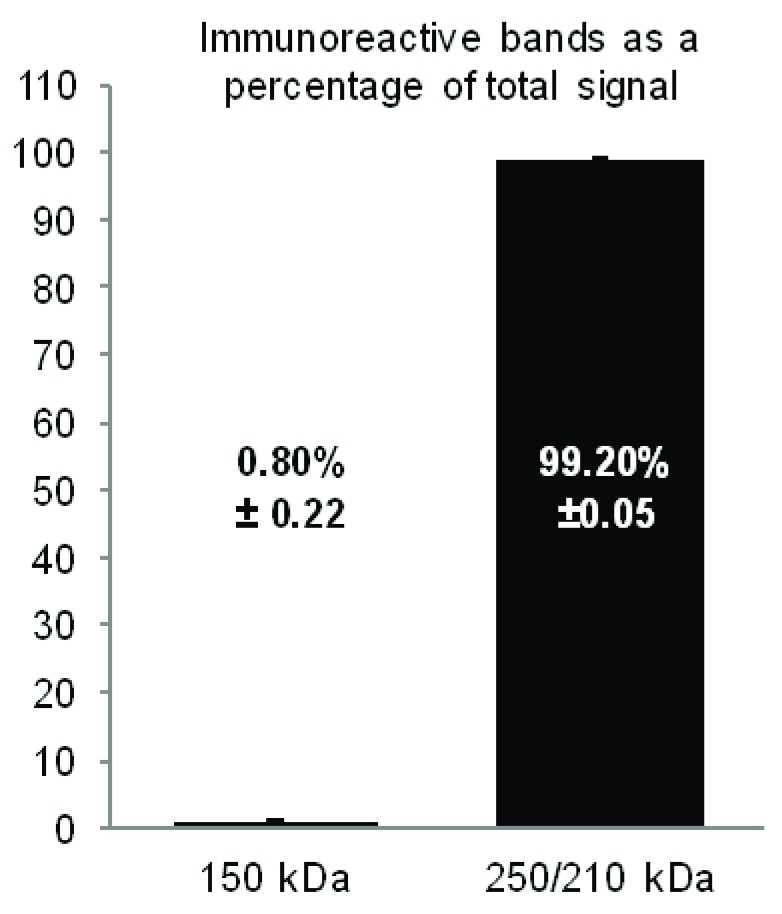
Figure 8. Quantification of α 11.2 Size Forms.
Ca v1.2 was immunoprecipitated from mouse brain extracts (Triton X-100) with FP1 before fractionation by SDS-PAGE and immunoblotting with FP1 and CNC1 antibodies (see Figure 3 and Figure 6). All α 11.2 immunoreactive bands at the longest film exposure were quantified in Adobe Photoshop, shown here as average percent of total immunoreactivity per blot.

