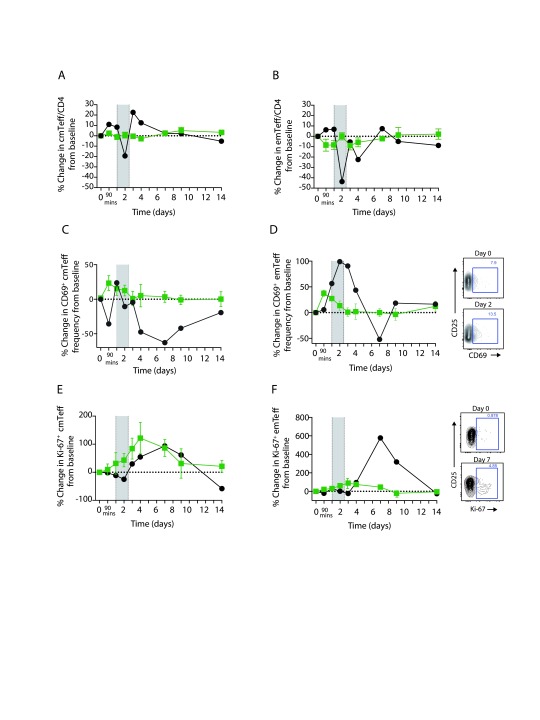
Figure 6. Dynamic effector memory CD4 + T cell responses to norovirus infection.
The percentage change in frequency of CD4 + cmTeffs ( A), CD4 + emTeffs ( B) of total CD4 + T cells from baseline levels. The percentage change in frequency of CD69 + CD4 + cmTeffs ( C), CD69 + CD4 + emTeffs ( D), Ki-67 + CD4 + cmTeffs ( E) and Ki-67 + CD4 + emTeffs ( F) relative to their respective baseline levels in uninfected participants (filled green square+/-SEM) and the norovirus-infected participant (filled black circles). The shaded area indicates the period of reported gastroenteritis. Contour plots showing expression of CD69 and CD25 ( D) and Ki-67 and CD25 ( F) on CD4 + emTeffs pre-IL-2 administration (day 0) and at the peak of the response in the norovirus-infected participant (day 2 or 7 respectively).

