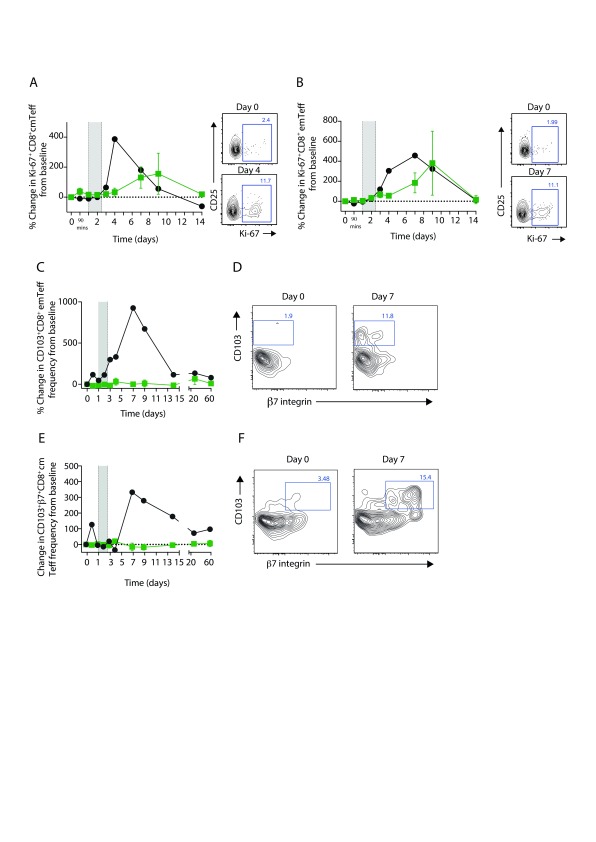
Figure 8. The emergence of memory CD8 + Teffs in cell cycle and with mucosal homing capacity post-norovirus infection.
The percentage change in frequency of Ki-67 + CD8 + cmTeffs ( A) and Ki-67 + CD8 + emTeffs ( B). Contour plots for each cell subset show Ki-67 and CD25 expression pre-IL-2 administration and at the peak of the response in the norovirus-infected participant. Timecourse analysis of the frequency of CD103 +CD45RA −CD27 − CD8 + emTeffs of total CD8 + T cells ( C). Contour plots showing the frequency of CD103 +β7integrin −/loCD45RA −CD27 − CD8 + emTeffs at day 0 and day 7 post-IL-2 ( D). ( E) The change in frequency of CD103 +β7integrin +CD45RA −CD27 + CD8 + cmTeffs of total CD8 + T cells relative to baseline levels. ( F) Contour plots showing the frequency of CD103 +β7 integrin +CD45RA −CD27 + CD8 + cmTeffs at day 0 and day 7 post-IL-2. ( A, B, C and E) data were normalised to and expressed as percentage change from baseline (day 0) in uninfected participants (filled squares +/- SEM) or the norovirus-infected participant (filled circles). Analyses were performed using cryopreserved PBMCs. The shaded area indicates the period of reported gastroenteritis.

