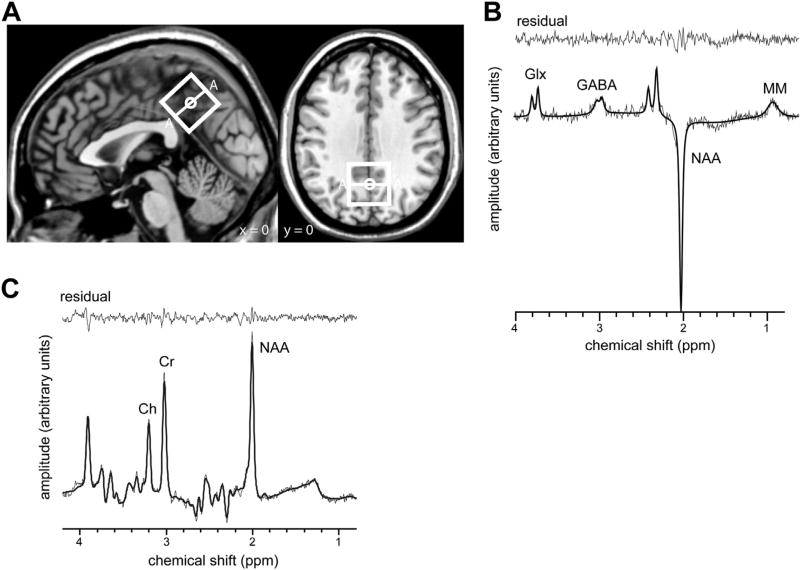
Fig. 1.
MRS voxel position (A) and representative single-subject spectra (B and C). (A) The MRS voxel (indicated by white rectangles shown on sagittal and axial views) was placed in the posterior cingulate cortex, without including the splenium of the corpus callosum. (B) Representative 68 ms sub-spectrum (PRESS) with raw data (fine black line), fit (bold black line), and residual (fine black line on top). (C) The single-subject MEGA-PRESS spectrum shows peaks of Glx, GABA, NAA, and macromolecules (MM). Raw data are indicated by the fine black line, the spectral fit by the bold black line. The residual is shown on top (thin black line). MRS values are depicted in arbitrary units. Abbreviations: GABA, γ-aminobutyric acid; Glx, glutamate + glutamine; MRS, magnetic resonance spectroscopy; NAA, N-acetyl-aspartate; PRESS, point-resolved spectroscopy sequence.

