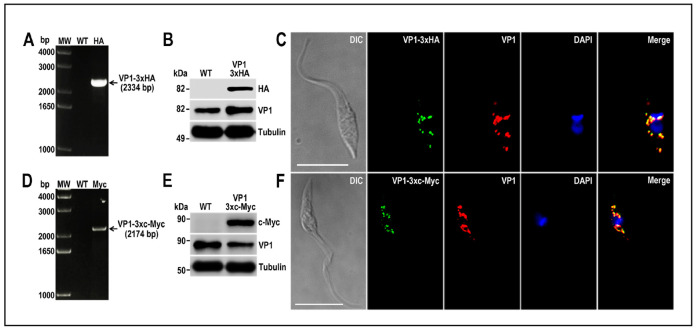
Figure 7. TcVP1 endogenous C-terminal tagging.
A. PCR analysis using gDNA isolated from wild type (WT) and TcVP1-3xHA cell lines. A DNA fragment was amplified in 3xHA-tagged epimastigotes (indicated with arrow), while the band is absent in WT. B. Western blot analysis of WT and TcVP1-3xHA cell lines. Anti-HA antibodies detect TcVP1-3xHA (expected size 89 kDa) and anti-TbVP1 antibodies detect endogenous TcVP1 (85 kDa). Anti-α-tubulin antibody was used as a loading control. Antibodies are indicated on the right side of the blots and molecular weights on the left side. C. Fluorescence microscopy of TcVP1-3xHA epimastigotes indicates localization of the endogenous tagged protein to acidocalcisomes. TcVP1-3xHA was detected with monoclonal anti-HA antibodies (green) or with polyclonal anti-TbVtc4 antibodies (red). D. PCR analysis of TcVP1-3xc-Myc epimastigotes. A DNA fragment was amplified in c-Myc-tagged epimastigotes (indicated with arrow), while the band is absent in WT cells. E. Western blot analysis of WT and TcVP1-3xc-Myc cell lines. Anti-c-Myc antibodies detect TcVP1-3xc-Myc (expected size 91 kDa). Anti-TbVP1 antibodies detect endogenous TcVP1 (85 kD). F. Fluorescence microscopy of TcVP1-3xc-Myc epimastigotes indicates localization of the endogenous tagged protein to acidocalcisomes. TcVP1-3xc-Myc was detected with monoclonal anti-c-Myc antibodies (green) or with polyclonal anti-TbVP1 antibodies (red). The merge shows co-localization in yellow. Differential interference contrast (DIC) images are shown on the left panel. Nucleus and kinetoplast were labeled with DAPI (blue). Bars = 10 μm. This figure was originally published in Lander et al., 2016b .

