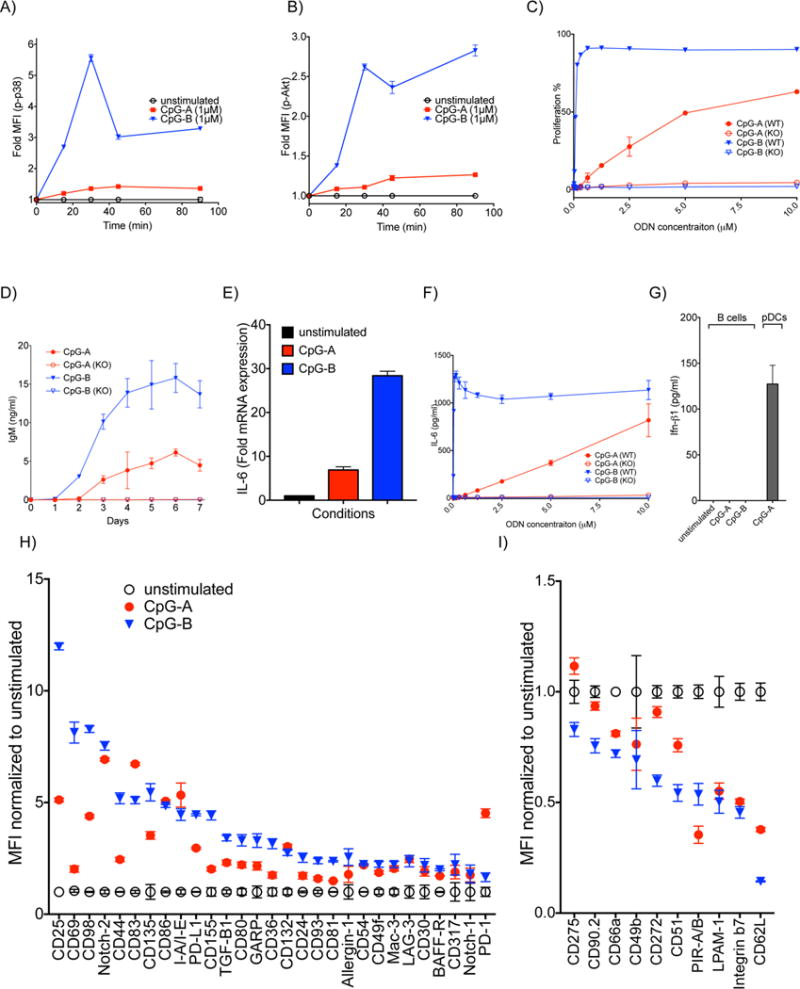
Figure 1.

The effect of CpG-A and CpG-B on B cells in vitro. A-B) B cells were treated with 1 μM CpG-A or CpG-B for increasing lengths of time. The fold change of phosphorylation of kinases in stimulated versus unstimulated B cells was determined by phosphoflow. Shown are the fold changes in MFI for: A) phospho-p38 and B) phospho-Akt. C) B cells purified from spleens of either WT or TLR9 KO mice were incubated with increasing concentrations of CpG-A or CpG-B for 48 h. The percentage of B cells that proliferated at least once was determined by flow cytometry. D) B cells purified from WT or TLR9 KO mice were incubated with 2 μM CpG-A or CpG-B. Supernatants were collected daily for 7 days and levels of secreted IgM were measured by ELISA. E) Purified mouse B cells were stimulated with 5 μM CpG-A or CpG-B for 90 min and the fold changes in the levels of mRNA encoding IL-6 compared to the unstimulated B cells were determined by qPCR. F) B cells were purified and treated as in (C) and the levels of IL-6 in the supernatants was measured 18 h later. G) Purified B cells or as a positive control, pDCs isolated from spleens, were treated with 5 μM CpG-A or CpG-B for 16 h and the levels of IFN-β in the supernatants were measured by ELISA. H,I) Purified B cells were treated with 2 μM CpG-A or CpG-B for 24 h. Cells were barcoded, pooled and stained with PE- conjugated Abs specific for the surface markers shown. H) Fold up-regulation or I) down-regulation in the MFI of markers compared to untreated cells are shown. Data represent at least three independent experiments each of which contains three replicates.
