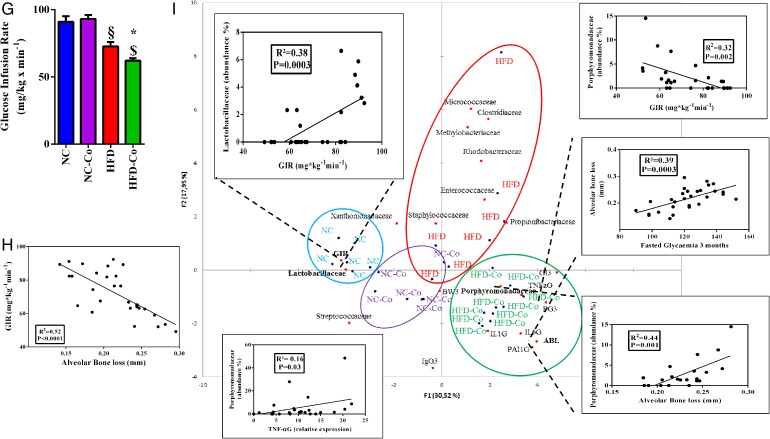
Figure 2.
Periodontitis enhances high-fat diet (HFD)-induced metabolic disorders in mice. Glycaemic profiles (mg/dL) during an intraperitoneal glucose-tolerance test (IpGTT; normal chow (NC, blue bar, n=6), normal chow colonised (NC-Co, purple bar, n=6), high-fat diet (HFD, red bar n=7) and high-fat diet colonised (HFD-Co, green bar, n=10)) and glycaemic indexes as inset; ratio fat/lean for each group during 1 month (A and B), 2 months (C and D) and 3 months (E and F). (G) Insulin sensitivity evaluated by the euglycemic-hyperinsulinemic clamp technique. (H) Correlation between glucose infusion rate (GIR) and alveolar bone loss (ABL). (I) Principal coordinate analysis (PCoA) between dominant bacterial families from periodontal microbiota (abundance >1%, detected at least in one mouse) and metabolic parameters such as ABL, GIR, gingival inflammation (TNFaG, IL1bG, PAI1G, IL6G, where ‘G’ stands for gingival), immunoglobulin G score, glycaemic index, fasted glycaemia and body weight at 3 months (IgG3, GI3, FG3, BW3, respectively): the three insets represent the correlation between GIR and Lactobacillaceae family, Porphyromonadaceae family and Porphyromonadaceae family with ABL. Data are mean±SEM. Significant results when *p<0.05; **p<0.01 and ***p<0.001 when compared to HFD, §p<0.05 and §§§p<0.001 when compared to NC and $p<0.05 when compared to NC-Co as determined by two-way analysis of variance (ANOVA) with Bonferroni's post-test for (A), (C) and (E) and one-way ANOVA followed by Tukey's post-test for (B), (D), (F) and (G).

