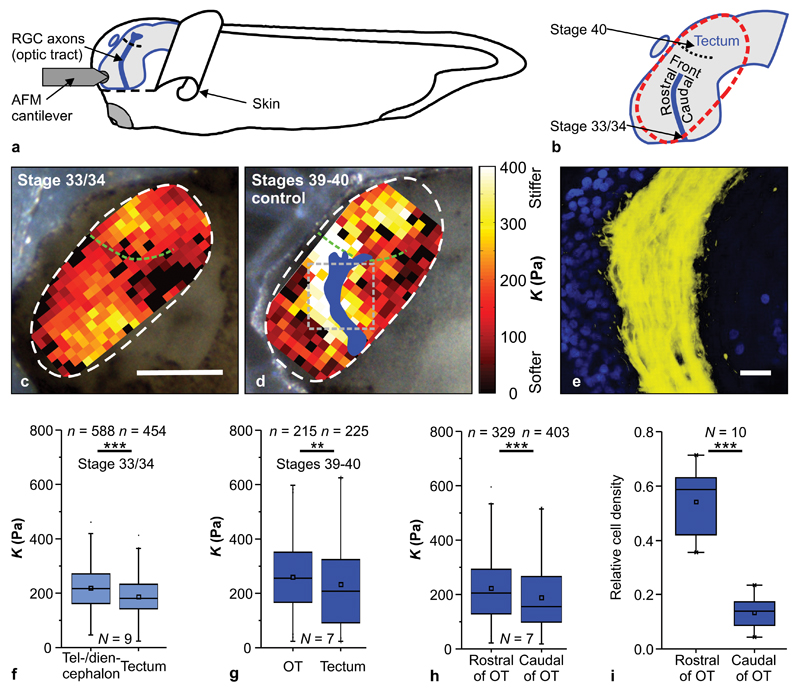
Figure 2. In vivo brain mechanics.
(a) Schematic of the experimental setup. (b) Xenopus brain. The dashed red line indicates the stiffness map area. (c, d) Images of Xenopus embryos with overlaid AFM-based stiffness maps of exposed in vivo brain tissue. Colour encodes the apparent elastic modulus K assessed at an indentation force of 7 nN. Blue shape in (d) shows the OT location (based on fluorescence images, Supplementary Fig. 3). Scale bar: 200 µm. At both stage 33/34 (c) and stages 39-40 (d), brain tissue was mechanically heterogeneous and displayed clearly visible stiffness gradients. Green dashed lines indicate tectum boundaries. The grey dashed square in (d) indicates a region as shown in (e). (e) Immunohistochemistry demonstrated a significantly higher density of cell nuclei (blue) rostral to the OT (yellow) than caudal to it. Scale bar: 20 µm. (f) The tectum was softer than the tel-/diencephalon at stage 33/34 (Mann-Whitney-Test; P = 2.26 × 10⁻⁹, Z = 5.978) and (g) than the OT at stages 39-40 (P = 0.0033, Z = 2.933). (h) At stages 39-40, tissue rostral of the OT was significantly stiffer than caudal of it (P = 2.97 × 10⁻⁵, Z = 4.163). (i) Quantification of cell density on both sides of the OT; cell density was significantly higher rostral to the OT (paired two-tailed t-test; P = 3.96 × 10⁻⁶, t = 9.879). n = number of measurements, N = animal numbers. All representative images and stiffness maps shown are from three biological replicates. Boxes show the 25th, 50th (the median), and 75th percentiles, whiskers the spread of the data.

