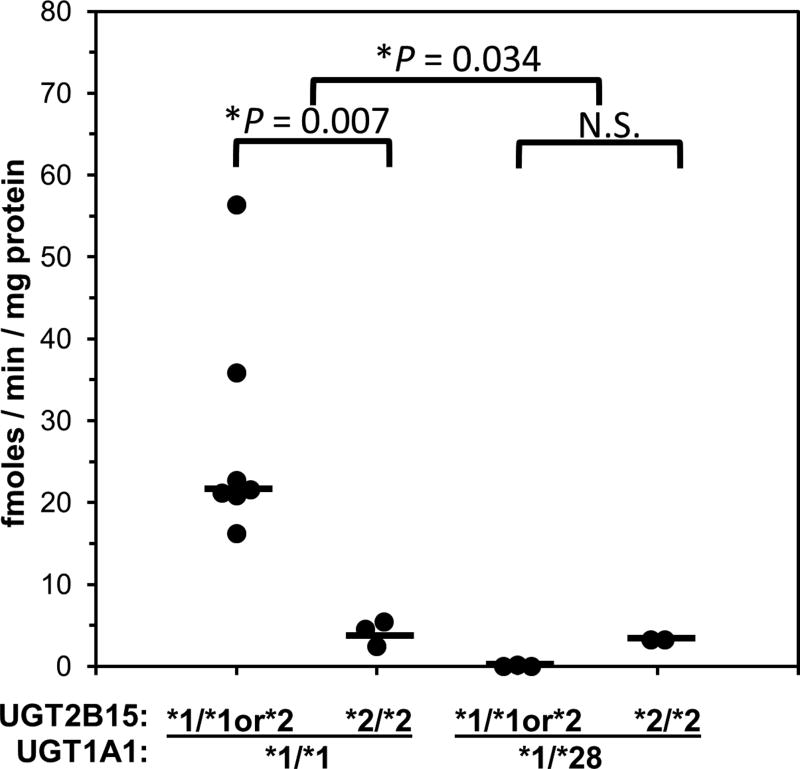
Figure 7.
Association of UGT1A1*28 and UGT2B15*2 genotype with BPA glucuronidation measured at 50 µM BPA concentration in 15 human breast microsomes samples. Shown are the glucuronidation activities determined for individual breast samples grouped by UGT1A1*28 genotype (*1/*1 versus *1/*28) and by UGT2B15*2 genotype (*1/*1 or *1/*2 versus *2/*2). Also shown are the median values (a horizontal bar) for each genotype group. Two-way ANOVA showed significantly lower activities in UGT1A1 *1/*28 versus *1/*1 breast samples (*P = 0.034), as well as an interaction (P = 0.04) between genotypes such that lower activities were observed for UGT2B15 *2/*2 samples compared with *1/*1 or *1/*2 samples (*P = 0.007, Dunn’s test) only in those samples that also had the UGT1A1*1/*1 genotype.

