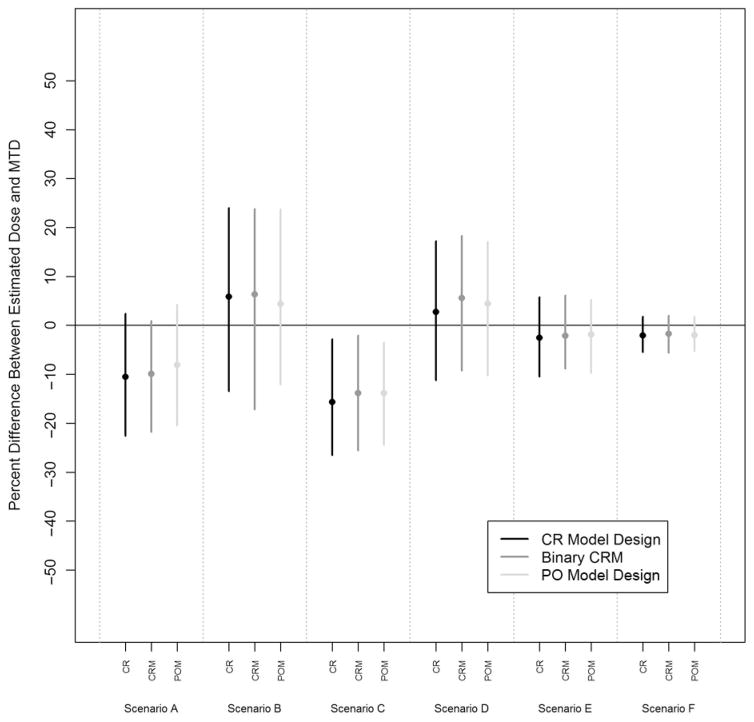
Figure 4.
Median percentage difference between the final estimated dose and the true MTD with the corresponding 25% and 75% quantile bands for the CR model design, binary CRM, and PO model design in each of the six scenarios.
CR: continuation ratio; CRM: continual reassessment method; PO: proportional odds; MTD: maximum tolerated dose.

