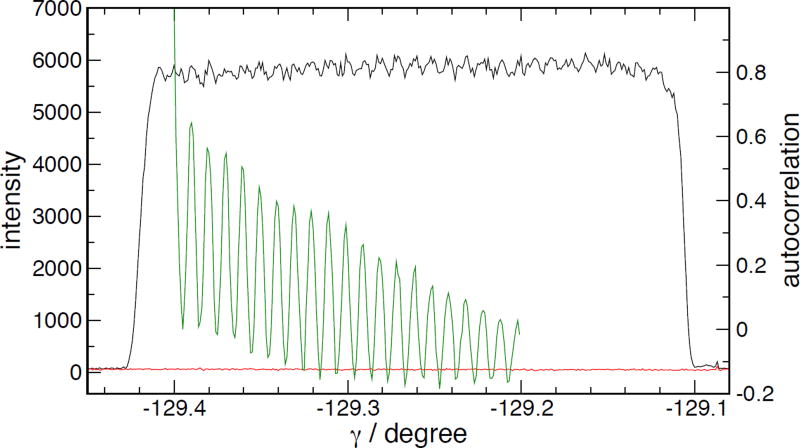
Figure 7.
Uniformity of response of camera, measured by γ scan. Black curve is measured response at top of Kα1. Green curve is autocorrelation of intensity (black) curve, showing high periodicity in spite of noise on full signal, arbitrarily shifted horizontally to show on the same scale as the intensity.

