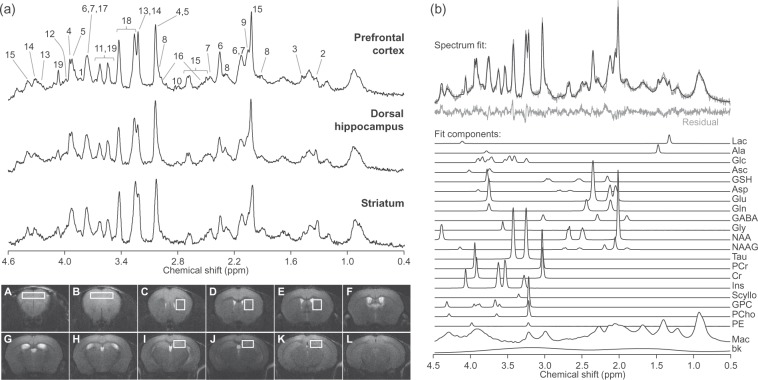
Figure 1.
Representative 1H spectra acquired in vivo at 14.1 T from the mouse prefrontal cortex, dorsal hippocampus and striatum (a). For display, spectra were processed with a shifted Gaussian function (gf = 0.12, gfs = 0.02) prior to Fourier transformation. Peak assignment is as follows: 1, glucose; 2, lactate; 3, alanine; 4, phosphocreatine; 5, creatine; 6, glutamate; 7, glutamine; 8, GABA; 9, N-acetylaspartylglutamate; 10, aspartate; 11, glycine; 12, phosphorylethanolamine; 13, phosphrylcholine; 14, glycerylphosphorylcholine; 15, N-acetylaspartate; 16, glutathione; 17, ascorbate; 18, taurine; 19, myo-inositol. Consecutive mouse brain slices from fast-spin-echo images (6-mm thickness) are displayed below. Typical placement of VOIs in the cortex, striatum and hippocampus is represented in slices A–B, C–E and I–K, respectively. LCModel fit of the top spectrum (prefrontal cortex) is represented in (b). The fit is overlaid on the spectrum and the resulting residual is shown below. Mac: macromolecules; bk: background baseline; see text for metabolites.

