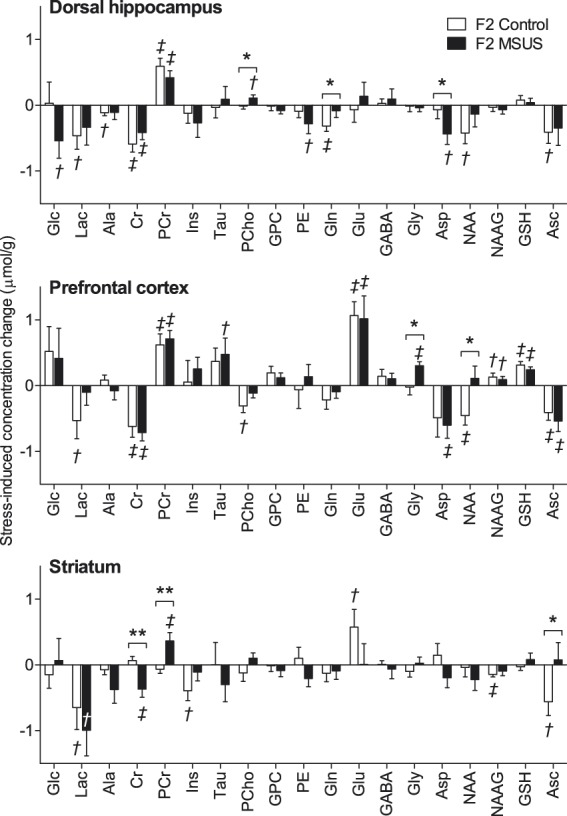
Figure 4.

Acute swim stress-induced variation of metabolite concentrations in the hippocampus, prefrontal cortex and striatum of the offspring (F2) of MSUS-exposed (n = 11) and control (n = 9) mice. Data are mean ± SEM. Multivariate ANOVA results: region F(36,182) = 101.0, P < 0.001; stress F(18,90) = 9.524, P < 0.001; MSUS F(18,90) = 2.725; P = 0.001; region*MSUS F(36,182) = 0.816, P = 0.773; stress*MSUS F(18,90) = 1.803; P = 0.032; region*stress F(36,182) = 2.552; P < 0.001; region*stress*MSUS F(36,182) = 1.166, P = 0.248. Post-hoc testing significant stress-induced modifications are depicted by †P < 0.05 and ‡P < 0.01 (baseline vs. post-stress); MSUS-exposure effect was tested on concentration differences between post-stress and baseline (*P < 0.05, **P < 0.01). Abbreviations are as in Figure 2.
