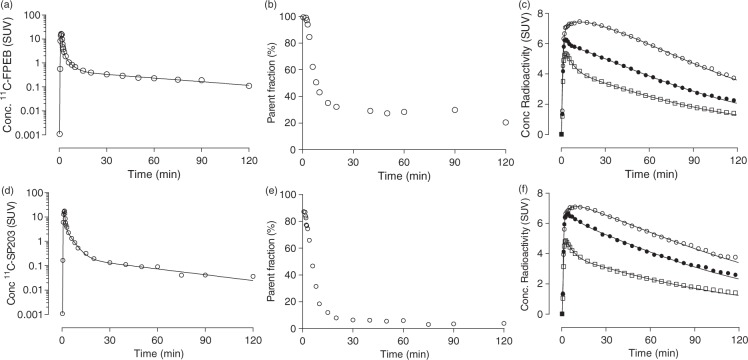
Figure 2.
Radioactivity concentrations, parent radioligand fraction in plasma, and brain time activity curves from a representative subject injected with [11C]FPEB (a–c) or [11C]SP203 (d–f). The first panels (a and d) for each radioligand plot the concentration of parent radioligand, separated from radiometabolites as a function of time after injection. The middle panels (b and e) show the percentage of total radioactivity in plasma that represents parent radioligand. The last panels (c and f) plot the concentrations of radioactivity in three brain regions as a function of time after injection. The lines represent the unconstrained two-tissue compartment model that well fit all data points. (o) putamen, (•) thalamus, and (□) cerebellum.

