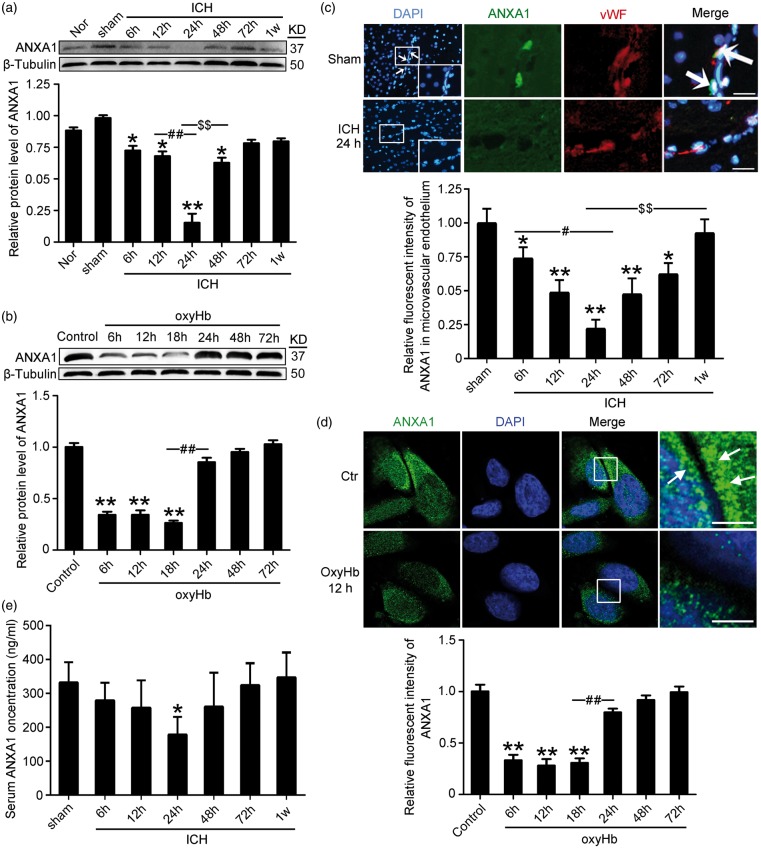
Figure 2.
The protein levels of ANXA1 in microvascular endothelium and serum after ICH and oxyHb-treatment hCMEC/D3 cells. (a) Western blot analysis and quantification of the protein level of ANXA1 in brain capillaries. (b) Western blot analysis and quantification of the protein level of ANXA1 in hCMEC/D3 cells. (c) Double immunofluorescence analysis was performed with antibody for ANXA1 (green) and endothelial cell marker (vWF, red) in sections. Nuclei were fluorescently labeled with DAPI (blue). Representative images of the sham and ICH (24 h) groups are shown. Scale bar = 100 µm. The relative fluorescent intensity of ANXA1 in microvascular endothelium is shown below. (d) Immunofluorescence analysis was performed with antibody for ANXA1 (green) in cultured hCMEC/D3 cells under indicated treatment. Nuclei were fluorescently labeled with DAPI (blue). Representative images of control group and oxyHb (12 h) group are shown. Arrows indicate the accumulation of ANXA1 around the cell edge. Scale bar = 20 µm. In (a–d), mean values for sham or control group were normalized to 1.0. One-way ANOVA followed by Student–Newman–Keulspost hoc tests were used. Data are means ± SEM. (a) *p = 0.021, 6 h group vs. sham group; *p = 0.018, 12 h group vs. sham group; *p = 0.011, 72 h group vs. sham group; **p < 0.01 vs. sham group; ##p < 0.01, $$p < 0.01, n = 6. (b) **p < 0.01 vs. sham group, ##p < 0.01, n = 3. (c) *p = 0.032, 6 h group vs. sham group; *p = 0.027, 72 h group vs. sham group; **p < 0.01 vs. sham group; #p = 0.028; $$p < 0.01, n = 6. (d) **p < 0.01 vs. control group; ##p < 0.01, n = 3. (e) ELISA assay of the serum content of ANXA1. Data are means ± SEM. *p = 0.029 vs. sham group, n = 6.

