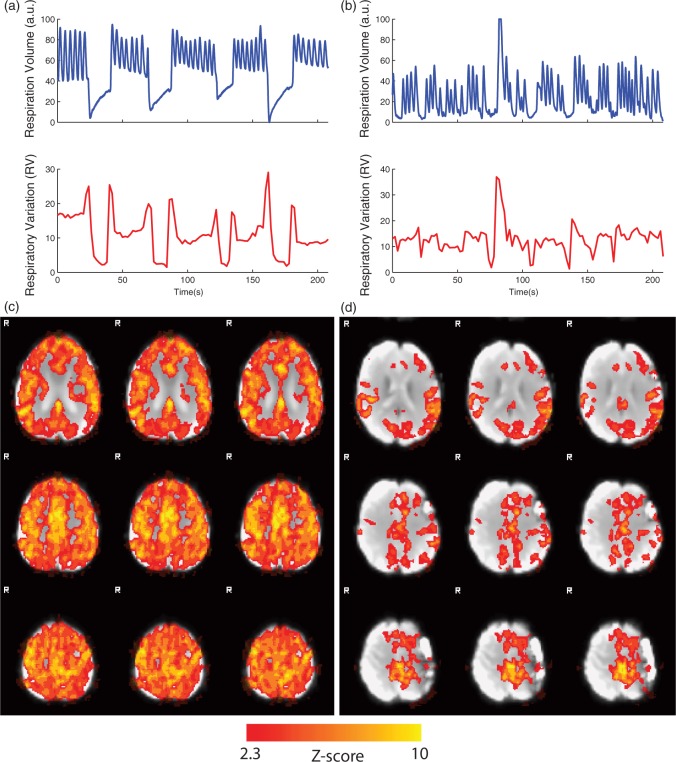
Figure 3.
Respiratory volume and respiratory variation (RV) time series shown for two representative subjects: (a) a subject with good compliance with the breath-holding task and (b) a subject with poor compliance with the breath-holding task. The corresponding vascular reactivity maps, thresholded at z > 2.3, for these subjects are shown in (c) and (d).

