
Figure 6.
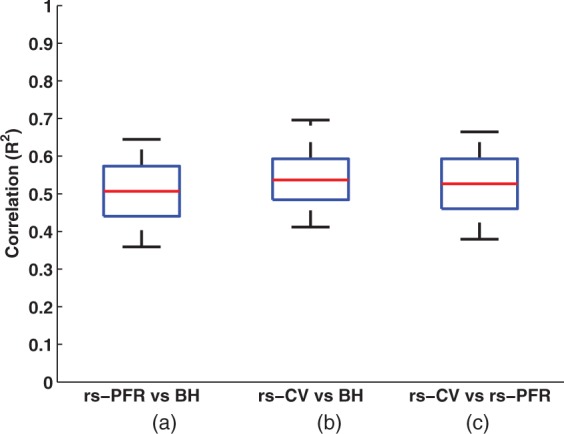
Voxel-wise correlation values (R2) across all subjects between vascular reactivity as calculated with BH versus and the two rs-fMRI methods: (a) rs-PFR and (b) rs-CV, both of which were strongly statistically significant (P < 0.001). Additionally, the correlation between rs-PFR and rs-CV (c) was also significant (P < 0.001). Correlation values were calculated separately over the whole GM and WM voxels for each subject. The red line and whiskers, respectively, represent first and third quartiles, median, and minimum/maximum of the results in each individual.
rs-PFR: resting-state physiological fluctuation regression; rs-CV: resting-state coefficient of variation; BH: breath-holding.