Figure 1.
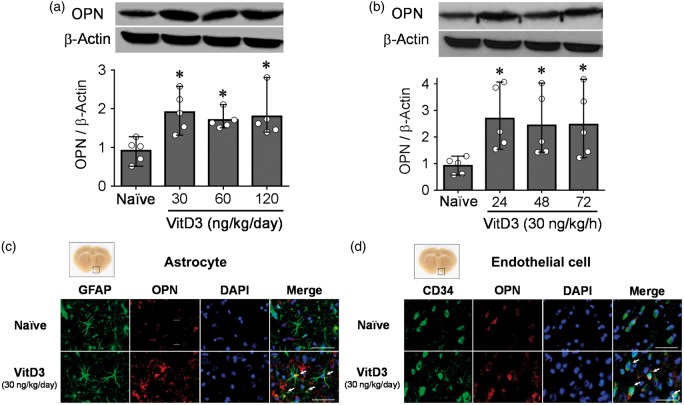
Intranasal administration of vitamin D3 (VitD3) upregulates endogenous osteopontin (OPN). (a) Representative Western blots of VitD3-induced dose-dependent (30, 60, 120 ng/kg/day) expression of OPN (upper panel) and quantitative analysis (lower panel) 24 h after intranasal administration in brain hemispheres of naïve rats (n = 5 per group). (b) Representative Western blots of time-dependent expression of OPN (upper panel) and quantitative analysis (lower panel) after intranasal administration of 30 ng/kg/h VitD3 in left hemisphere of naïve rats (n = 5 per group). *P < 0.05 vs. naïve rats. (c) Immunohistochemical staining of OPN (red) and astrocytes (GFAP, green) (n = 3 per group). Nuclei are stained with DAPI (blue). Arrows indicate colocalization of OPN and GFAP. Top panel indicates the location of immunohistochemical staining (small black box). Bar = 50 µm. (d) Immunohistochemical staining of OPN (red) and endothelial cells (CD34, green) (n = 3 per group). Nuclei are stained with DAPI (blue). Arrows indicate colocalization of OPN and CD34. Top panel indicates the location of immunohistochemical staining (small black box). Bar = 50 µm.

