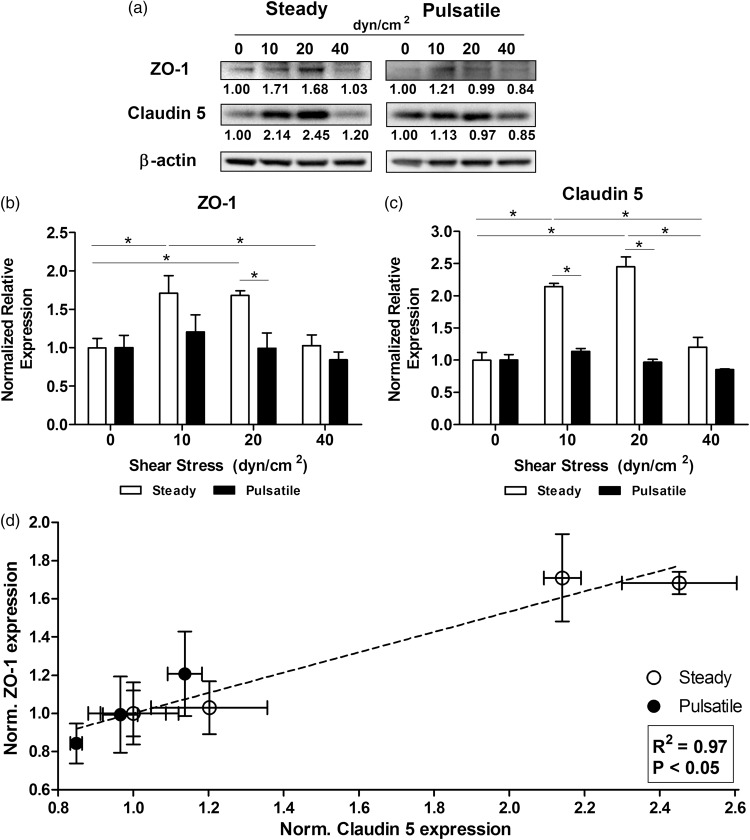
Figure 2.
Effect of shear stress patterns on the expression of tight junction markers. (a) HBMEC were exposed to shear stress for 96 h. Protein was extracted and tight junction markers were analyzed with Western blotting. Normalized average intensities are indicated below each band. Densitometric analysis of the expression of ZO-1 (b) and Claudin-5 (c) showed that abnormal steady shear stress levels of 40 dyn/cm2 downregulated the expression of tight junction proteins as opposed to capillary-like levels (10–20 dyn/cm2). Pulsatile patterns induced a lower expression compared to the respective steady shear stress level. (d) Expression of ZO-1 and Claudin-5 induced by steady and pulsatile flow patterns showed linear correlation. *p ≤ 0.05 between indicated bars.

