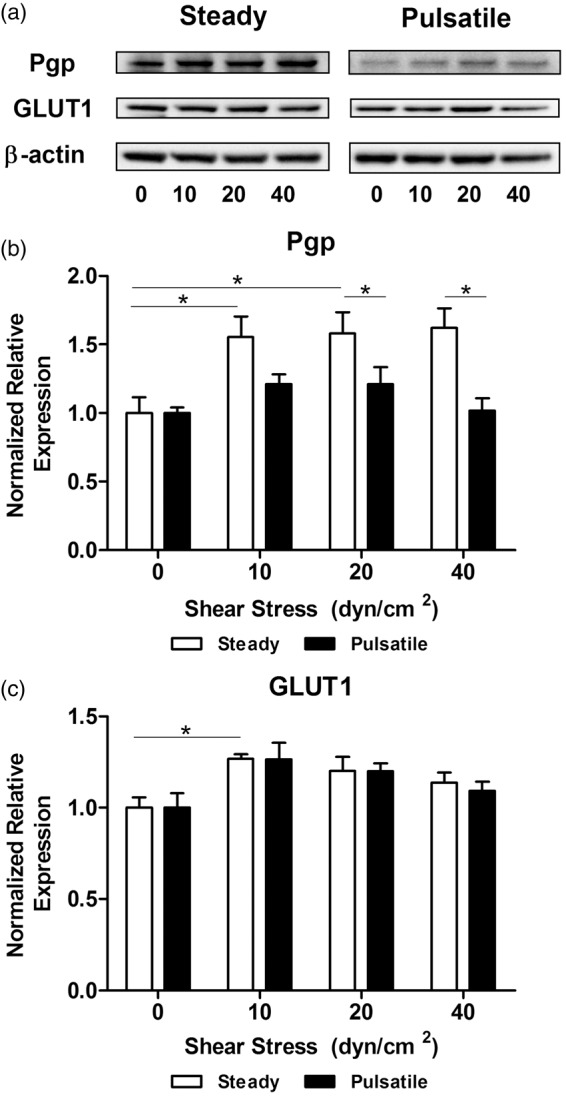
Figure 4.

Effect of shear stress patterns on the expression of key transport markers. (a) HBMEC were exposed to shear stress for 96 h. Protein was extracted and transport proteins were analyzed with Western blotting. Densitometric analysis of the expression of P-glycoprotein (b) and GLUT1 (c) showed different responses. P-gp was significantly upregulated under steady shear stress, but pulsatile flow decreased the expression. GLUT1 showed only a statistical upregulation with steady flow at 10 dyn/cm2. *p ≤ 0.05 between indicated bars.
