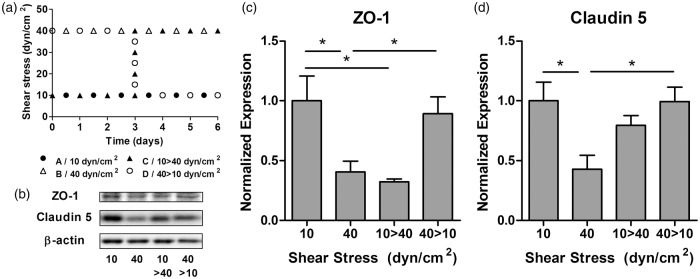
Figure 5.
Shear stress reversibility effects on tight junction markers. (a) HBMEC were exposed to steady flow for 6 days, maintaining shear stress at 10 and 40 dyn/cm2 or switching both levels at day 3. (b) Protein was extracted and transport proteins were analyzed with Western blotting. Densitometric analysis of the expression of ZO-1 (c) and Claudin-5 (d) showed that HBMEC are able to adapt their expression from a lower level at 40 dyn/cm2 to a significantly higher level at 10 dyn/cm2. *p ≤ 0.05 between indicated bars.

