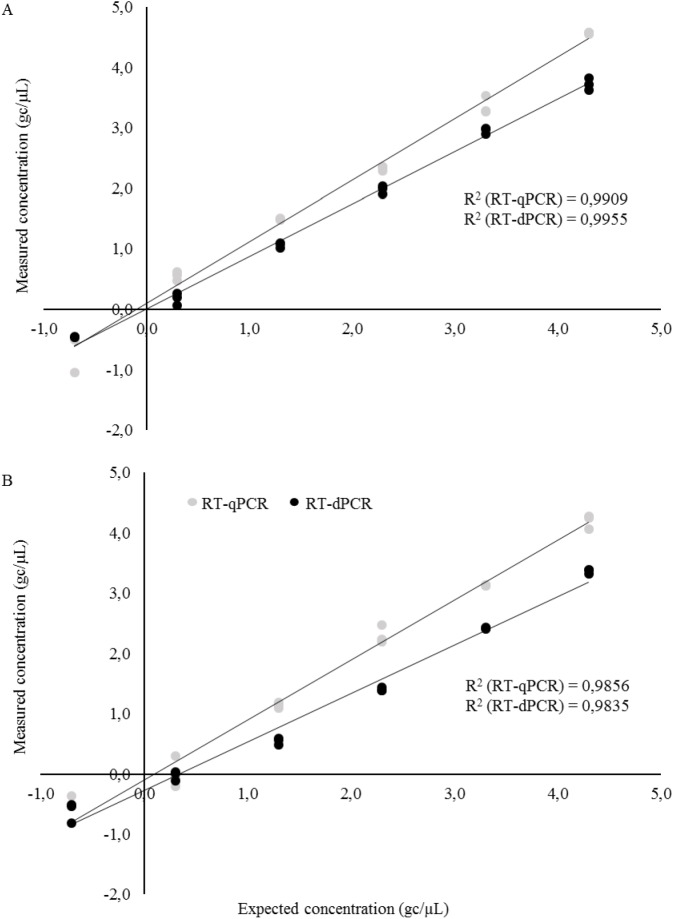
Fig 1.
Regression plots representing linearity for RT-qPCR and RT-dPCR for NoVGI (A) and NoVGII (B) (RT-qPCR: grey circles; RT-dPCR: black circles). The x-axis indicates expected concentration based on OD measurements for NoVGI and NoVGII as described in Materials and Methods, and y-axis is the measured concentration for both detection methods.

