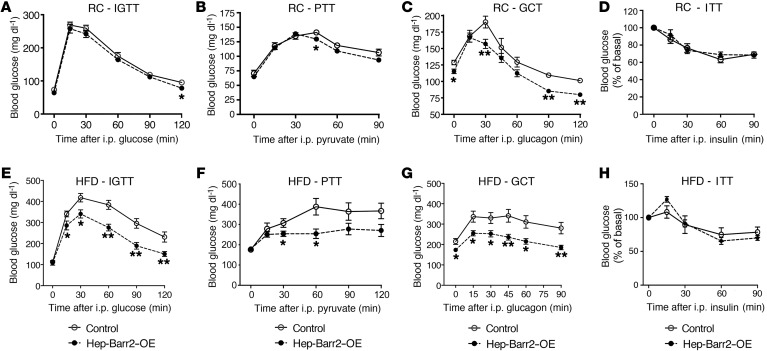
Figure 3. In vivo studies with hep-barr2–OE mice and their control littermates.
(A–H) In vivo metabolic tests carried out with mice maintained on RC (A–D) or HFD (E–H). Animals were maintained on the HFD for at least 8 weeks. Mice were subjected to i.p. glucose tolerance test (A and E), pyruvate tolerance test (B and F), glucagon challenge test (C and G), and ITT (D and H). Data are shown as mean ± SEM (8–10 mice per group; 12- to 16-week-old males). *P < 0.05; **P < 0.01, versus control (Student’s t test).

