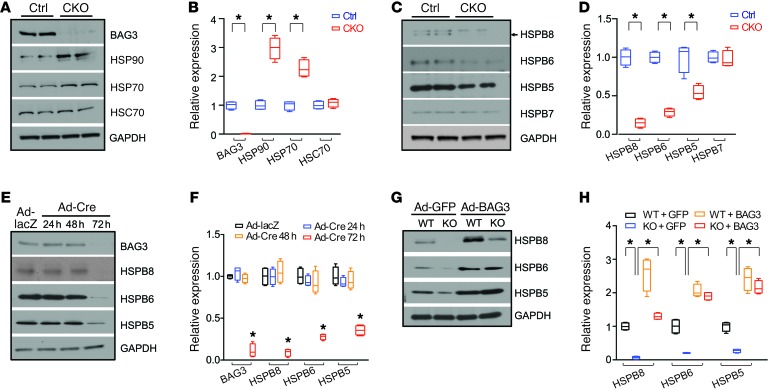
Figure 2. BAG3 deficiency leads to the downregulation of protein levels of sHSPs.
(A–D) Representative immunoblots (A and C) and quantification analysis (B and D) of BAG3, HSP90, HSP70, HSC70 (A and B), and HSPB5, -6, -7, and -8 (C and D) in adult cardiomyocytes isolated from control and CKO mice. n = 4 mice per group. (E and F) Neonatal cardiomyocytes were isolated from Bag3fl/fl mice and infected with Ad-Cre (20 MOI) for 24, 48, and 72 hours. Ad-lacZ was used as a control. Representative immunoblots (E) and quantification analysis (F) of BAG3 and HSPB5, -6, and -8. n = 4. GAPDH served as a loading control. (G and H) Neonatal cardiomyocytes were isolated from Bag3 global-KO mice or WT controls and infected with BAG3-overexpressing adenovirus (Ad-BAG3) (20 MOI) for 36 hours. GFP adenovirus (Ad-GFP) was used as a control. Representative immunoblots (G) and quantification analysis (H) of HSPB5, -6, and -8. n = 4. GAPDH served as a loading control. Data are represented as the mean ± SEM. *P < 0.05, by 2-tailed Student’s t test or 2-way ANOVA.

