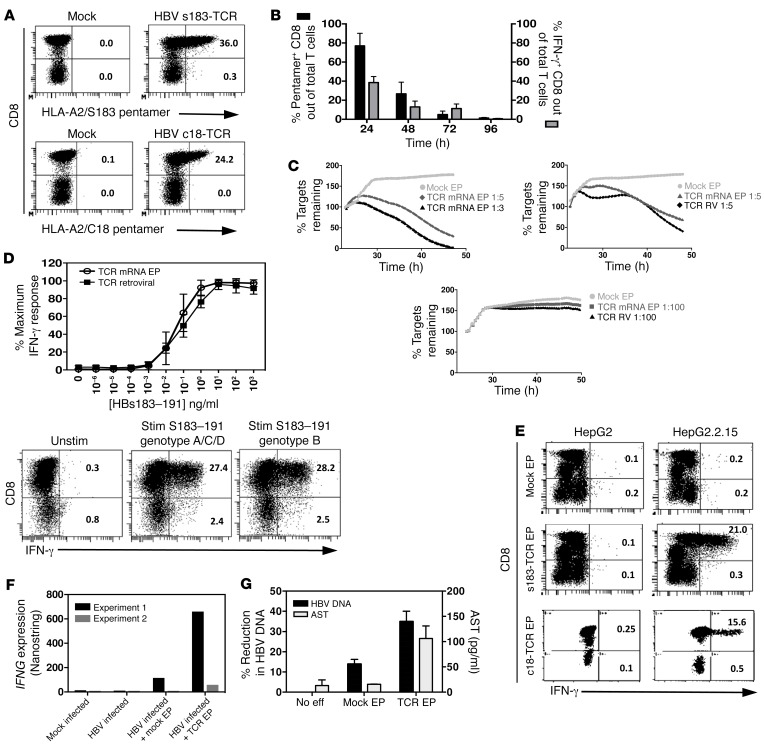
Figure 1. Lytic and antiviral function of mRNA HBV–specific TCR–electroporated T cells in vitro.
(A) Activated T cells were electroporated with HBV s183–TCR or c18-TCR mRNA, and TCR expression was determined 24 hours after electroporation. Mock electroporated T cells served as negative control. Shown are representative plots. The percentages of HLA-A2/pentamer+ cells out of CD8+ or CD8− T cells are indicated. (B) TCR expression on electroporated cells was measured longitudinally from 24 hours to 96 hours. Electroporated T cells were cocultured with their respective peptide-pulsed T2 cells for 18 hours, and the frequencies of IFN-γ–producing CD8+ T cells out of total lymphocytes were quantified. (C) The ability of mRNA TCR–electroporated T cells to lyse HepG2.2.15 HBV–producing cells at 1:3, 1:5, and 1:100 E:T ratios within 24 hours after T cell addition was compared with that of retroviral transduced (TCR RV) T cells. (D) Sensitivity of T cell activation, displayed as percentage of maximum IFN-γ response using mRNA TCR–electroporated T cells compared with retroviral-transduced T cells (upper panel). MRNA HBV s183–TCR–electroporated T cells were cocultured with HBV s183–191 genotype B (FLLTKILTI) or genotype A/C/D (FLLTRILTI) peptide-loaded T2 cells. The percentages of CD8+ or CD8− T cells producing IFN-γ are indicated (lower panel). (E) Mock, mRNA HBV s183–TCR, or c18-TCR–electroporated T cells were cocultured with either HepG2 or HepG2.2.15 cells for 24 hours. The percentages of CD8+ or CD8− T cells producing IFN-γ are indicated. (F) mRNA HBV s183–TCR or c18-TCR–electroporated T cells were cocultured with mock or HBV-infected HepG2-NTCP for 24 hours, and IFNG gene expression was determined using NanoString analysis. (G) Mock or mRNA HBV s183–TCR–electroporated T cells were cocultured with HepG2.2.15 cells at a 1:3 E:T ratio for 24 hours, and intracellular HBV DNA was quantified by real-time quantitative PCR (qPCR). AST levels were determined in coculture media. Shown are means of percentage reduction in intracellular HBV DNA ± SD (black bars) and means of AST ± SD (gray bars) from 3 independent experiments (right panel).

