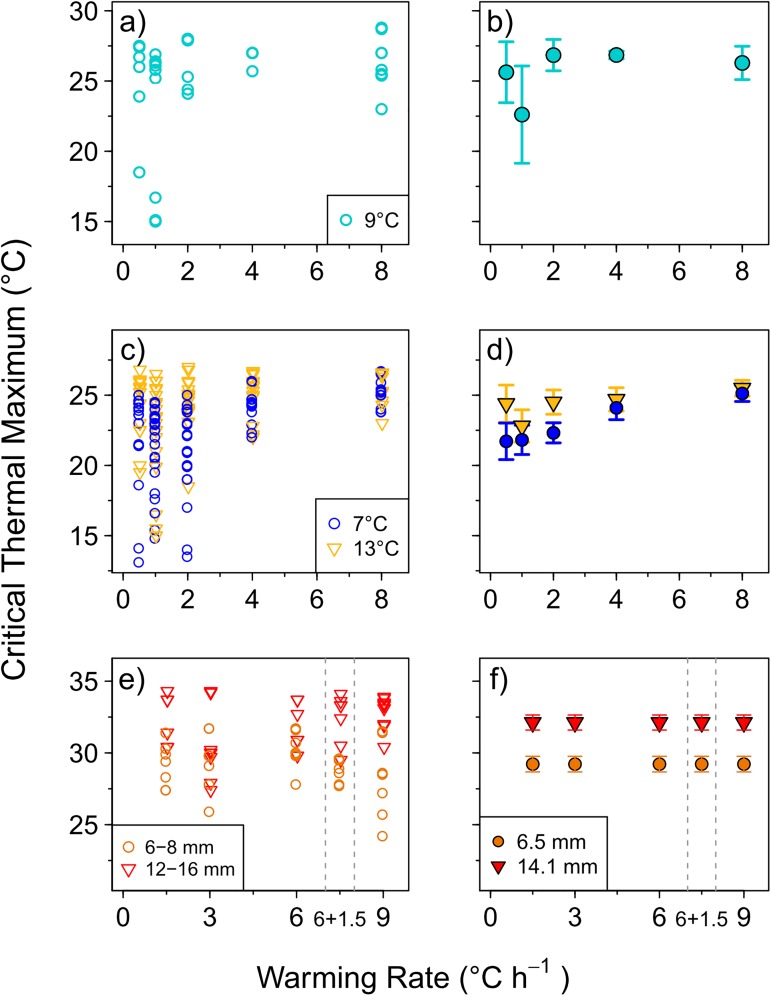
Fig 2.
Critical thermal maxima (CTmax) estimates of Atlantic herring yolk sac larvae (a-b) and exogenously feeding larvae (c-d), and European seabass exogenously feeding larvae (e-f) at different warming rates. Left-hand panels show CTmax of individual larvae. Right-hand panels show the mean treatment values (± 95% CI) from Generalized Linear Model (see S1 Table), except for yolk sac larvae (panel b) in which mean (±95% CI) CTmax values are shown (as no model was fitted to this dataset).

