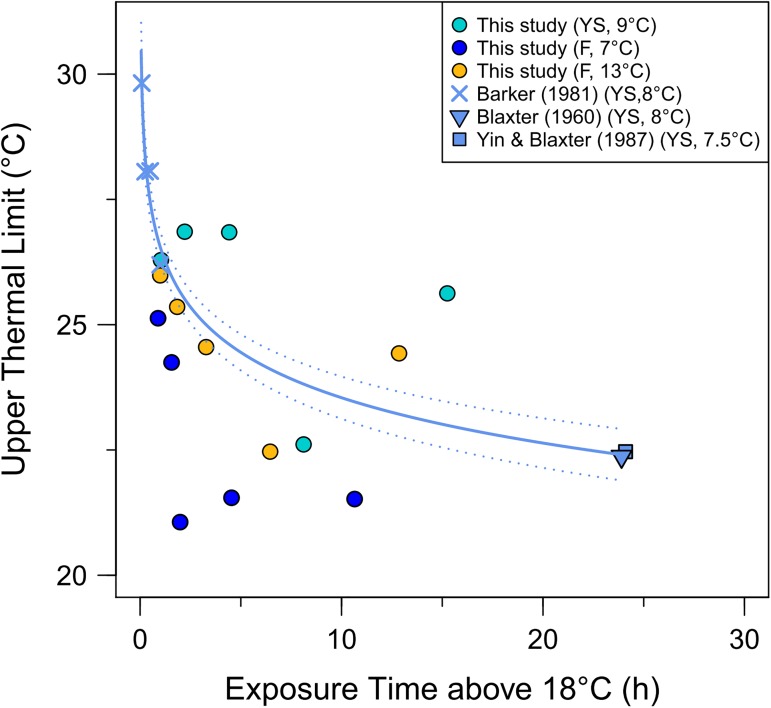
Fig 3. Time dependency of upper thermal limits in Atlantic herring larvae.
Values for upper thermal limit (UTL, °C) including both LT50max and CTmax estimates (see text) versus exposure time (t, h) beyond temperatures favorable for growth (>18°C). The LTmax and CTmax estimates for yolk-sac (YS), and feeding larvae (F) at two temperatures (7 and 13°C) are also shown. For the LT50max data of YS larvae, the best fit regression equation (solid line) is UTL = 26.55(± 0.16 SE)—1.31(±0.08 SE) * Ln(t), (p<0.001), 95% CI of the curve are included as a dotted line.

