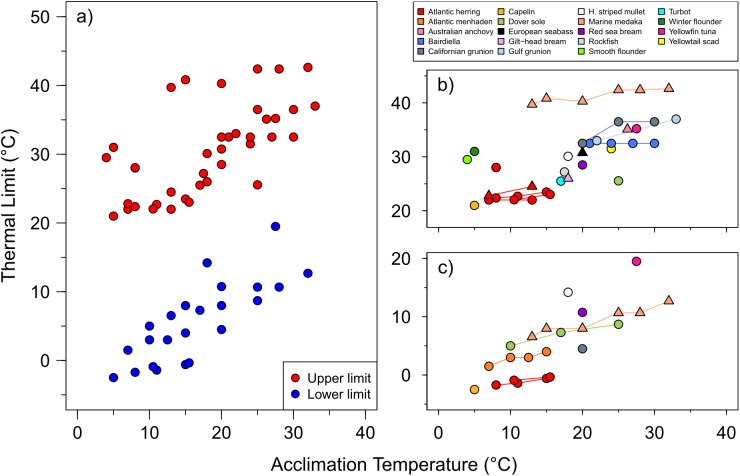
Fig 4. Upper and lower thermal limits of marine fish larvae.
a) Average upper (red) and lower thermal limits (blue) of marine fish larvae at different acclimation temperatures. b) Detail of the upper (LT50max, CTmax), and c) lower limits (LT50min, CTmin), color-coded by species and shape-coded by method (static, circles; dynamic, triangles). Lines connect estimates from the same study. Study details are provided in Table 1.

