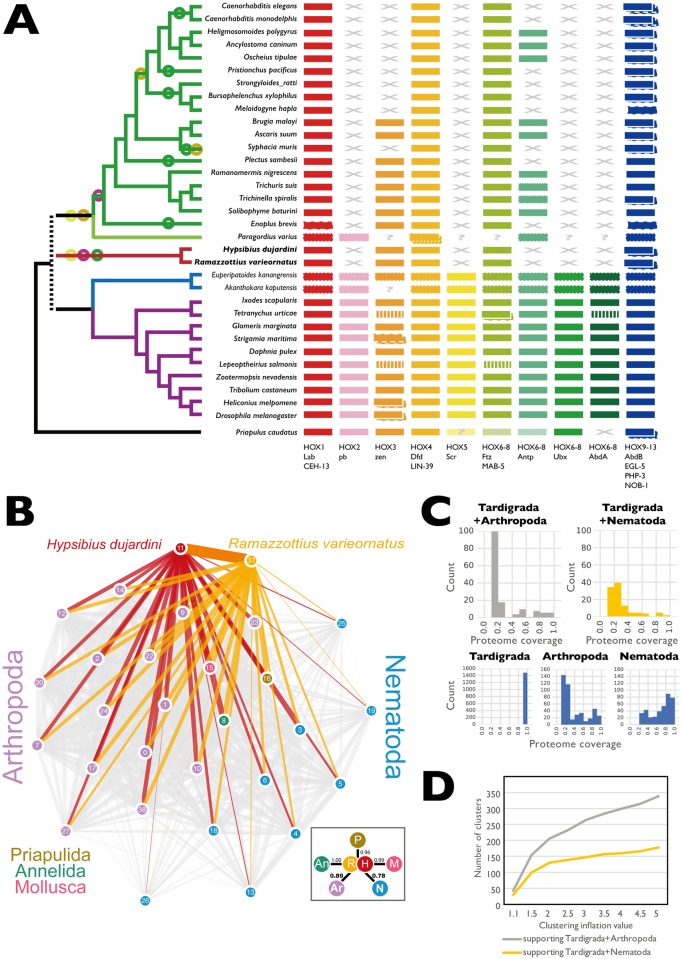
Fig 5. The position of tardigrada in Ecdysozoa.
(A) HOX genes in tardigrades and other Ecdysozoa. HOX gene losses in Tardigrada and Nematoda. HOX gene catalogues of tardigrades and other Ecdysozoa were collated by screening ENSEMBL Genomes and WormBase Parasite. HOX orthology groups are indicated by different colors. Some “missing” HOX loci were identified by Basic Local Alignment Search Tool (BLAST) search of target genomes (indicated by vertical striping of the affected HOX). “?” indicates that presence/absence could not be confirmed because the species was surveyed by PCR or transcriptomics; loci identified by PCR or transcriptomics are indicated by a dotted outline. “X” indicates that orthologous HOX loci were not present in the genome of that species. Some species have duplications of loci mapping to 1 HOX group, and these are indicated by boxes with dashed outlines. The relationships of the species are indicated by the cladogram to the left, and circles on this cladogram indicate Dollo parsimony mapping of events of HOX group loss on this cladogram. Circles are colored congruently with the HOX loci. (B) Evolution of gene families under different hypotheses of tardigrade relationships. Tardigrades share more gene families with Arthropoda than with Nematoda. In this network, derived from the OrthoFinder clustering at inflation value 1.5, nodes represent species (0: Anopheles gambiae, 1: Apis mellifera, 2: Acyrthosiphon pisum, 3: Ascaris suum, 4: Brugia malayi, 5: Bursaphelenchus xylophilus, 6: Caenorhabditis elegans, 7: Cimex lectularius, 8: Capitella teleta, 9: Dendroctonus ponderosae, 10: Daphnia pulex, 11: Hypsibius dujardini, 12: Ixodes scapularis, 13: Meloidogyne hapla, 14: Nasonia vitripennis, 15: Octopus bimaculoides, 16: Priapulus caudatus, 17: Pediculus humanus, 18: Plectus murrayi, 19: Pristionchus pacificus, 20: Plutella xylostella, 37: Ramazzottius varieornatus, 22: Solenopsis invicta, 23: Strigamia maritima, 24: Tribolium castaneum, 25: Trichuris muris, 26: Trichinella spiralis, 27: Tetranychus urticae, 38: Drosophila melanogaster). The thickness of the edge connecting 2 nodes is weighted by the count of shared occurrences of both nodes in OrthoFinder-clusters. Links involving H. dujardini (red) and R. varieornatus (orange) are colored. The inset box on the lower right shows the average weight of edges between each phylum and both Tardigrades, normalized by the maximum weight (i.e., count of co-occurrences of Tardigrades and the annelid C. teleta)" (C) Gene family birth synapomorphies at key nodes in Ecdysozoa under 2 hypotheses: Tardigrada+Nematoda versus Tardigrada+Arthropoda. Each graph shows the number of gene families at the specified node inferred using Dollo parsimony from OrthoFinder clustering at inflation value 1.5. Gene families are grouped by the proportion of taxa above that node that contain a member. Note that to be included as a synapomorphy of a node, a gene family must contain proteins of at least 1 species of each child node of the node in question, and thus, there are no synapomorphies with <0.3 proportional proteome coverage in Nematoda and <0.2 in Arthropoda, and all synapomorphies of Tardigrada have 1.0 representation. (D) Gene family birth synapomorphies for Tardigrada+Arthropoda (grey) and Tardigrada+Nematoda (yellow) for OrthoFinder clusterings performed at different Markov Cluster Algorithm (MCL) inflation parameters.

