
Fig. 8.
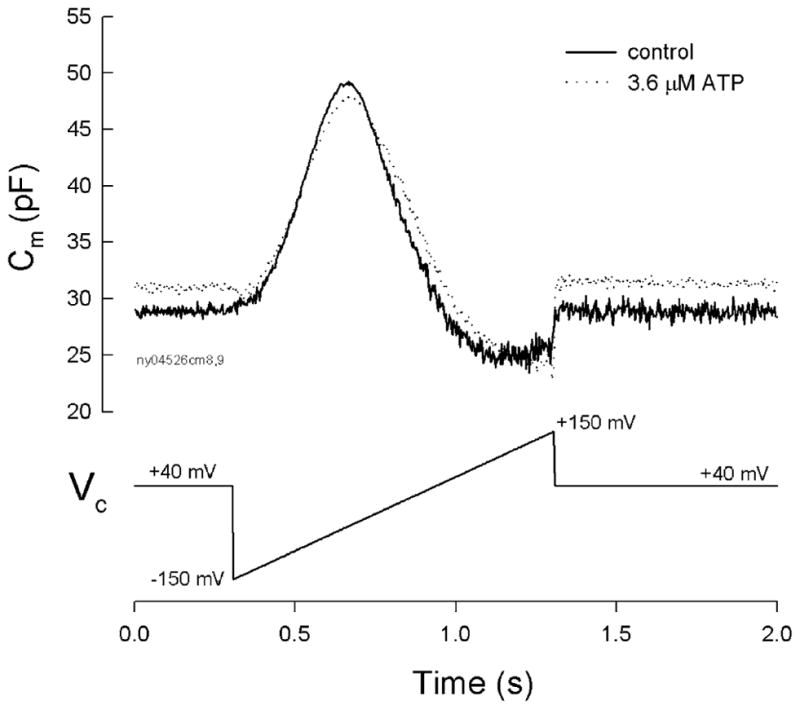
Ineffectiveness of positive holding potential on the ATP influence. The ATP effect on NLC was measured at the holding potential of +40 mV. Solid and dotted lines represent the membrane capacitance measured at control and 3.6 μM ATP application for 10 min, respectively. ATP reduced the peak of NLC and shifted the NLC curve to the positive direction. Note that there is a small (approximately 2 pF) increase rather than decrease in capacitance at the holding potential of +40 mV due to the right shift of the NLC curve in the presence of ATP. A trace at the bottom of the figure shows the voltage command