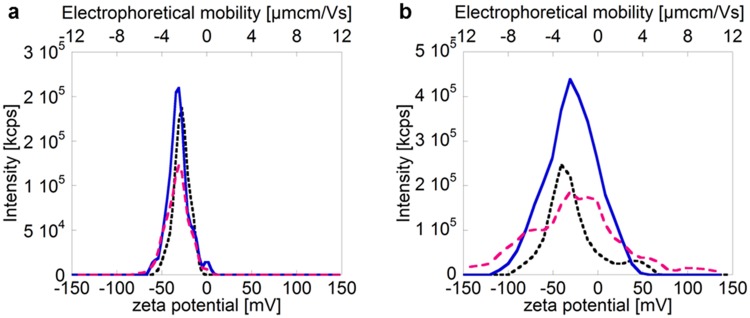
Fig 2. Zeta potential intensity distributions for three separate measurements of 10 nm citrate coated AgNPs (particle concentration: 10 μg mL-1) in (a) 10 mM NaCl and (b) 150 mM NaCl, with intensity (kcounts s-1) on the y-axis and zeta potential (mV) plus electrophoretic mobility (μmcmV-1s-1) on the x-axes.
The different curves represent three consecutive measurements of the same sample. The zeta potentials were determined using the Smoluschowski approximation.

