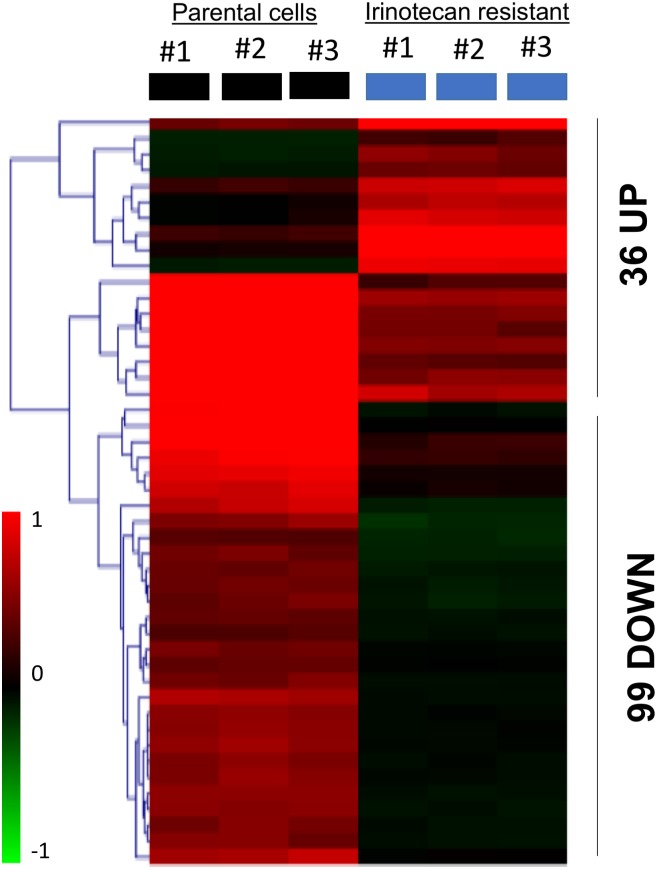
Fig 1. Heat map showing upregulated and downregulated differentially expressed genes (DEGs) in irinotecan-resistant colon cancer cells.
A bidirectional hierarchical clustering heat map Constructed using multiExperimental Viewer(MEV). The expression values are log2 fold changes (>1 or <−1, FDR <0.05)) between corresponding irinotecan-resistant HCT116 cell lines and parental HCT116 cell lines. Black represents no change in expression, green represents downregulation, and red represents upregulation.

