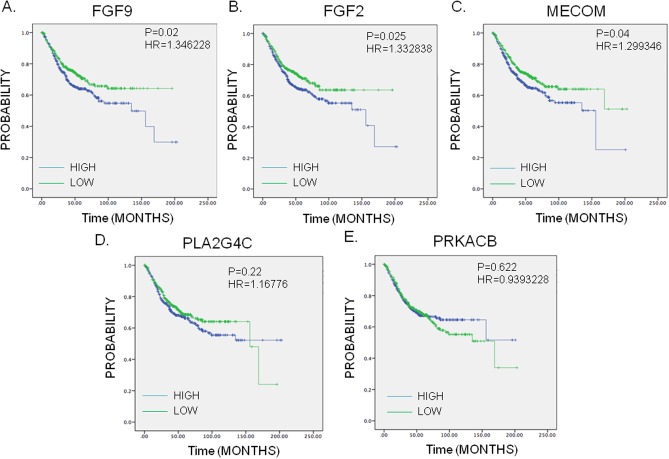
Fig 5. Kaplan-Meier survival curves presenting the prognostic relationship between high and low expression of specific genes involved in irinotecan resistance to overall survival (A) MECOM, (B) FGF2, (C) FGF9, (D) PLA2G4C and (E) PRKACB.
The survival curves were plotted using the survExpress online tool. The specific DEGs expression levels were dichotomized by median value and the results presented visually by Kaplan-Meier survival plots. P-values were calculated using log-rank statistics. Patient number = 808, HR = Hazard Ratio, P = Logrank P-value.

